Increase organic installs on Google Play with Textual Metadata ASO
PlatformAndroid
ToolsTextual Metadata ASO
BudgetNDA
ResultA 31% increase in total organic installs due to improved visibility of the app in search
About
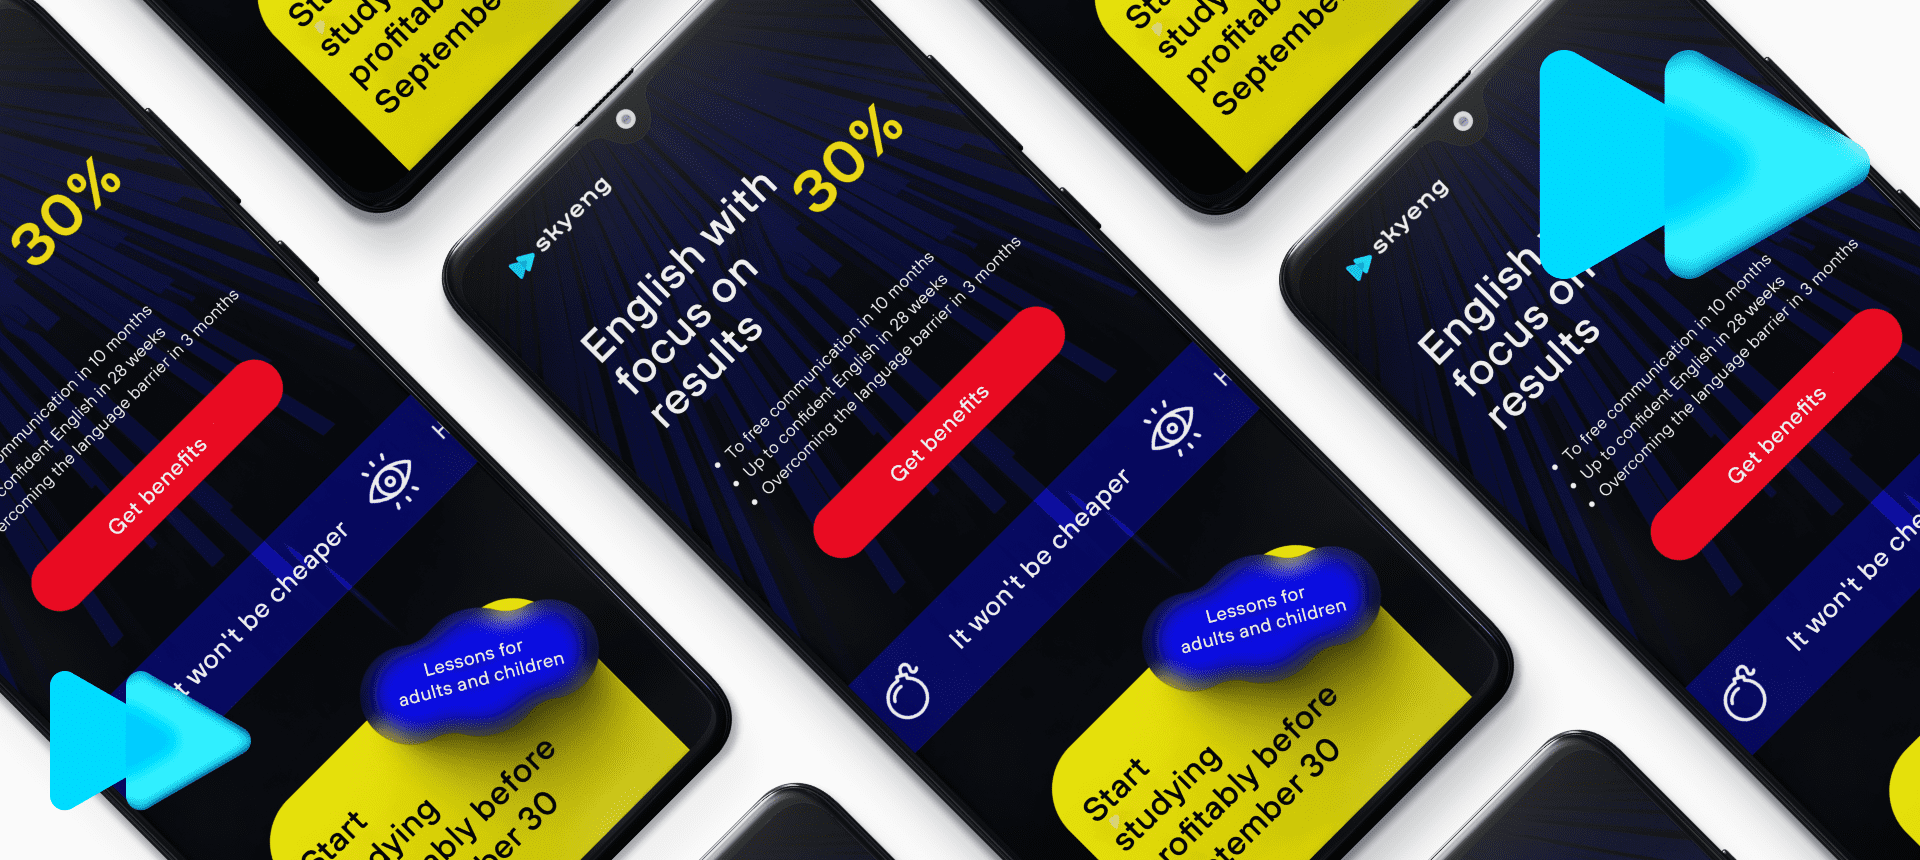
Skyeng is an online English language learning platform popular in Russia and Europe
The project has a web version and a mobile app available on the App Store and Google Play: both — the web version and the app — can be an entry point into the product. With this multi-platform approach, our user engagement strategies cover all areas, each with its own unique goals for attracting new users.In this case study we'll delve into our journey of enhancing the App Store Optimization (ASO) for the Skyeng app on Google Play, show you how we studied the market, put forward some hypotheses, and what we achieved.
Navigation
Disclaimer
Here is a lengthy case study of our work with the Skyeng app and the English Language Learning vertical in general.It will take about 20-30 minutes to read, but it's worth it!If necessary, add the material to your bookmarks to come back to it later.
What happened and context of the case study
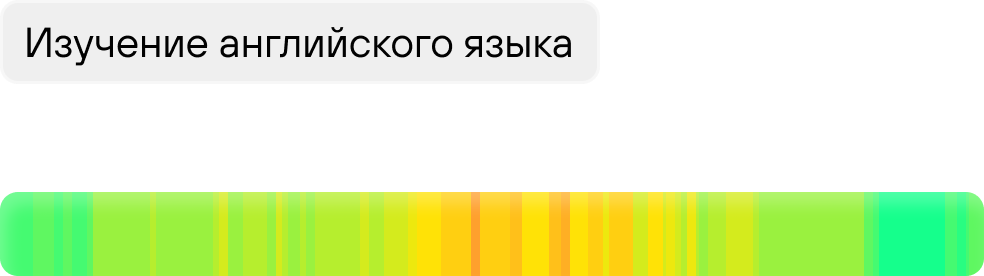
In the second half of July 2022, the app began to gradually lose ground on non-branded search requests on Google Play
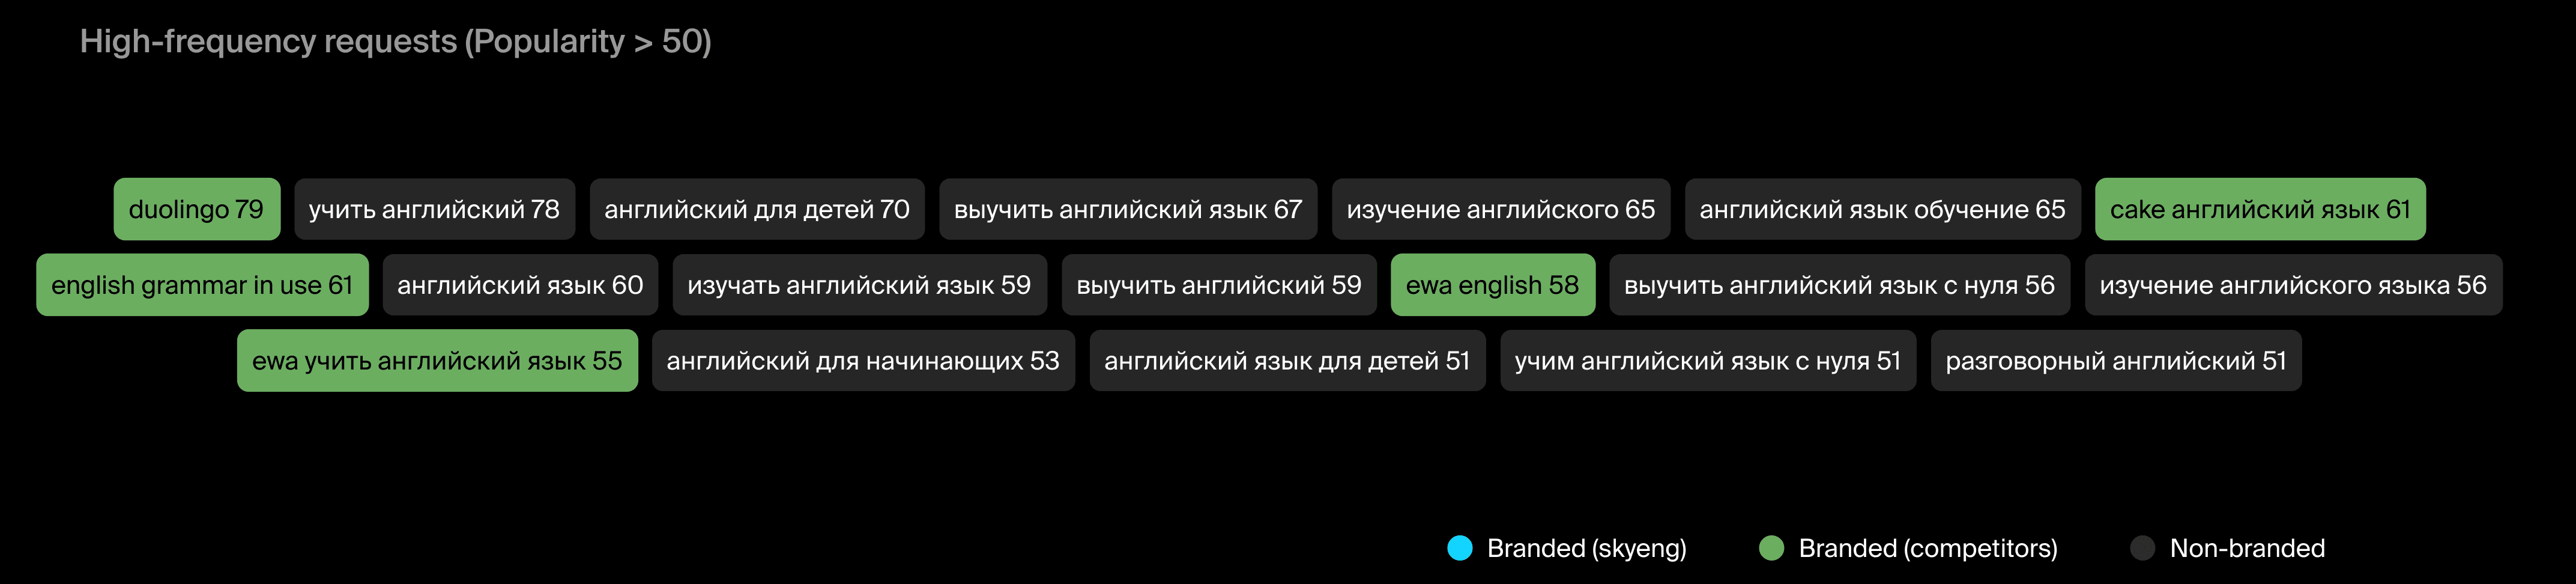
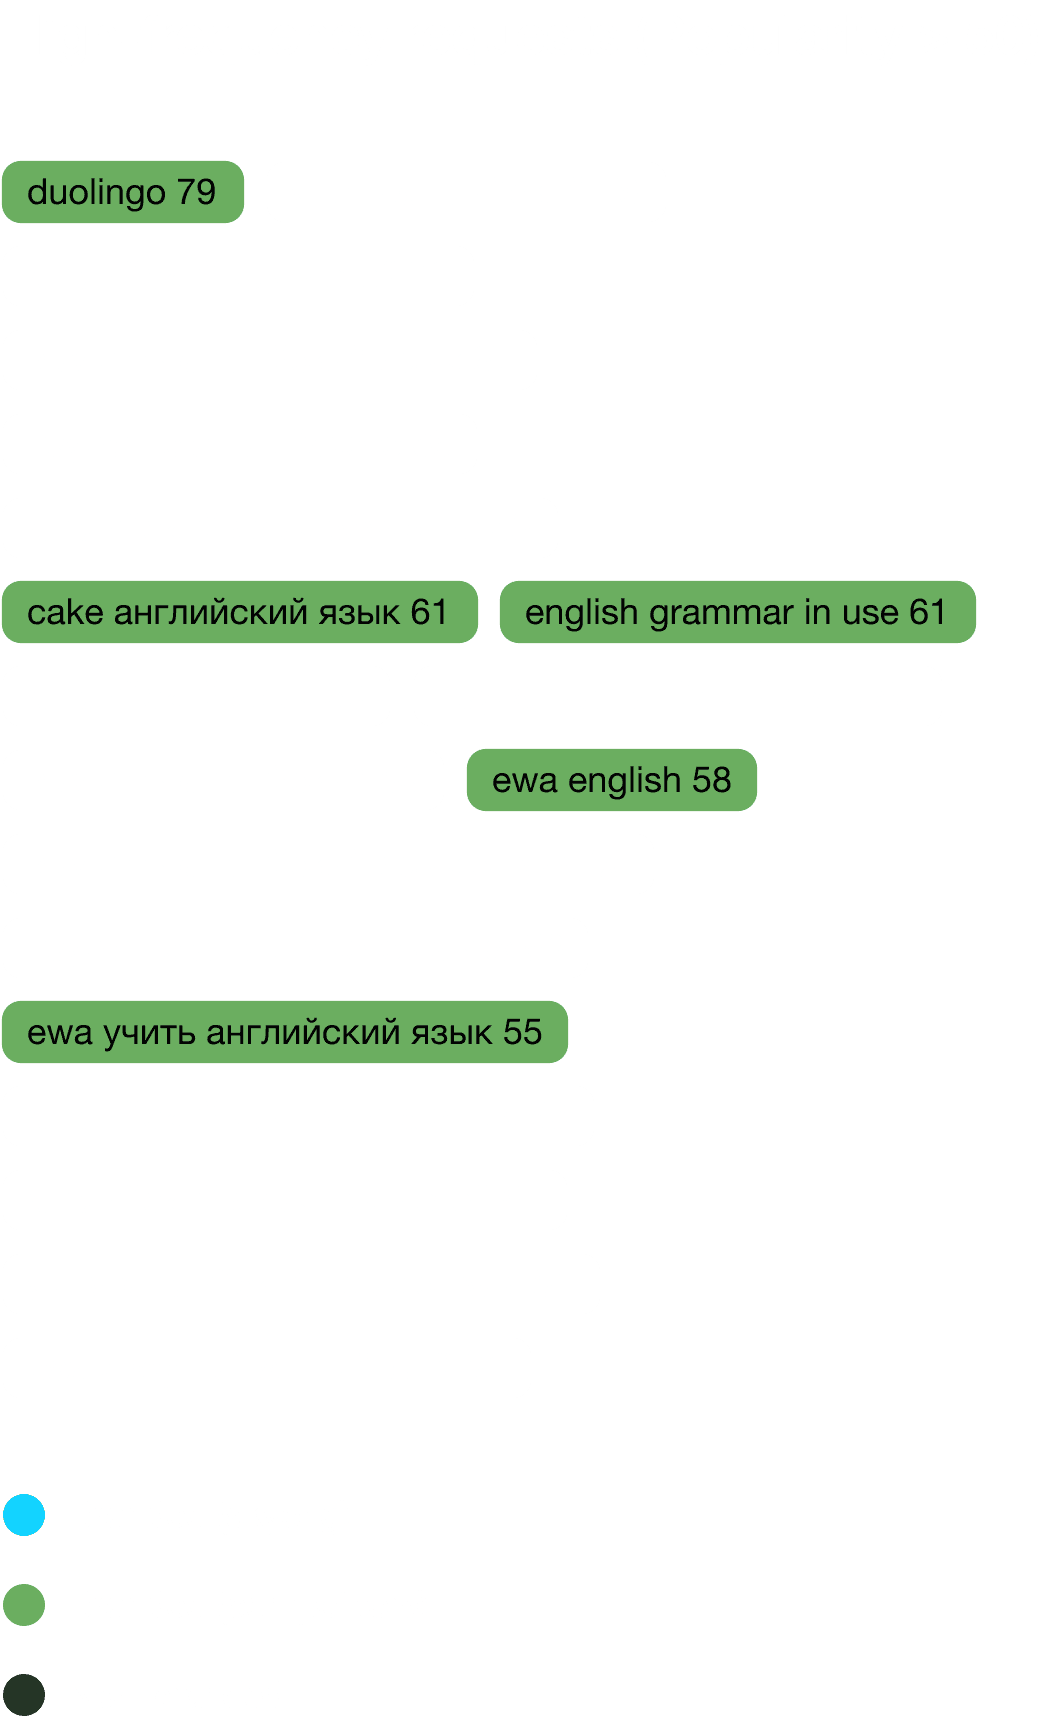
Online English language school Skyeng is one of the EdTech leaders in Russia. Investing heavily in marketing, it has a strong brand, which ensures a large number of organic installs, both for branded and non-branded search requests related to learning English.In this case study, we'll focus on organic traffic from Google Play searches for non-branded search requests. Let's first take a look at the top search requests in this vertical:
The context
Online English language school Skyeng is one of the EdTech leaders in Russia. Investing heavily in marketing, it has a strong brand, which ensures a large number of organic installs, both for branded and non-branded search requests related to learning English.In this case study, we'll focus on organic traffic from Google Play searches for non-branded search requests. Let's first take a look at the top search requests in this vertical:
Main search requests of the "English Language Learning" vertical
Read more about Popularity
It's important to note that Google Play doesn't provide accurate information on popularity of specific requests: all ASO platforms employing this assessment tool have to calculate it on their own, using their own tools. As different services use different evaluation methodologies, it would make no sense to compare data generated by different tools. And while the error may be mountain high, estimates correlate with real values in most cases. This popularity score can be used to compare query frequencies, organic demand in different verticals, and brand popularity studies. Popularity is a dynamic indicator that depends on demand and the seasons. To maintain accuracy, it's recommended to update this metric every few weeks. For the purposes of this case study, we've focused on the averages for July and August 2022. This specific timeframe provides us with sufficient data to draw some conclusions, overview the semantics, and deal with textual metadata.
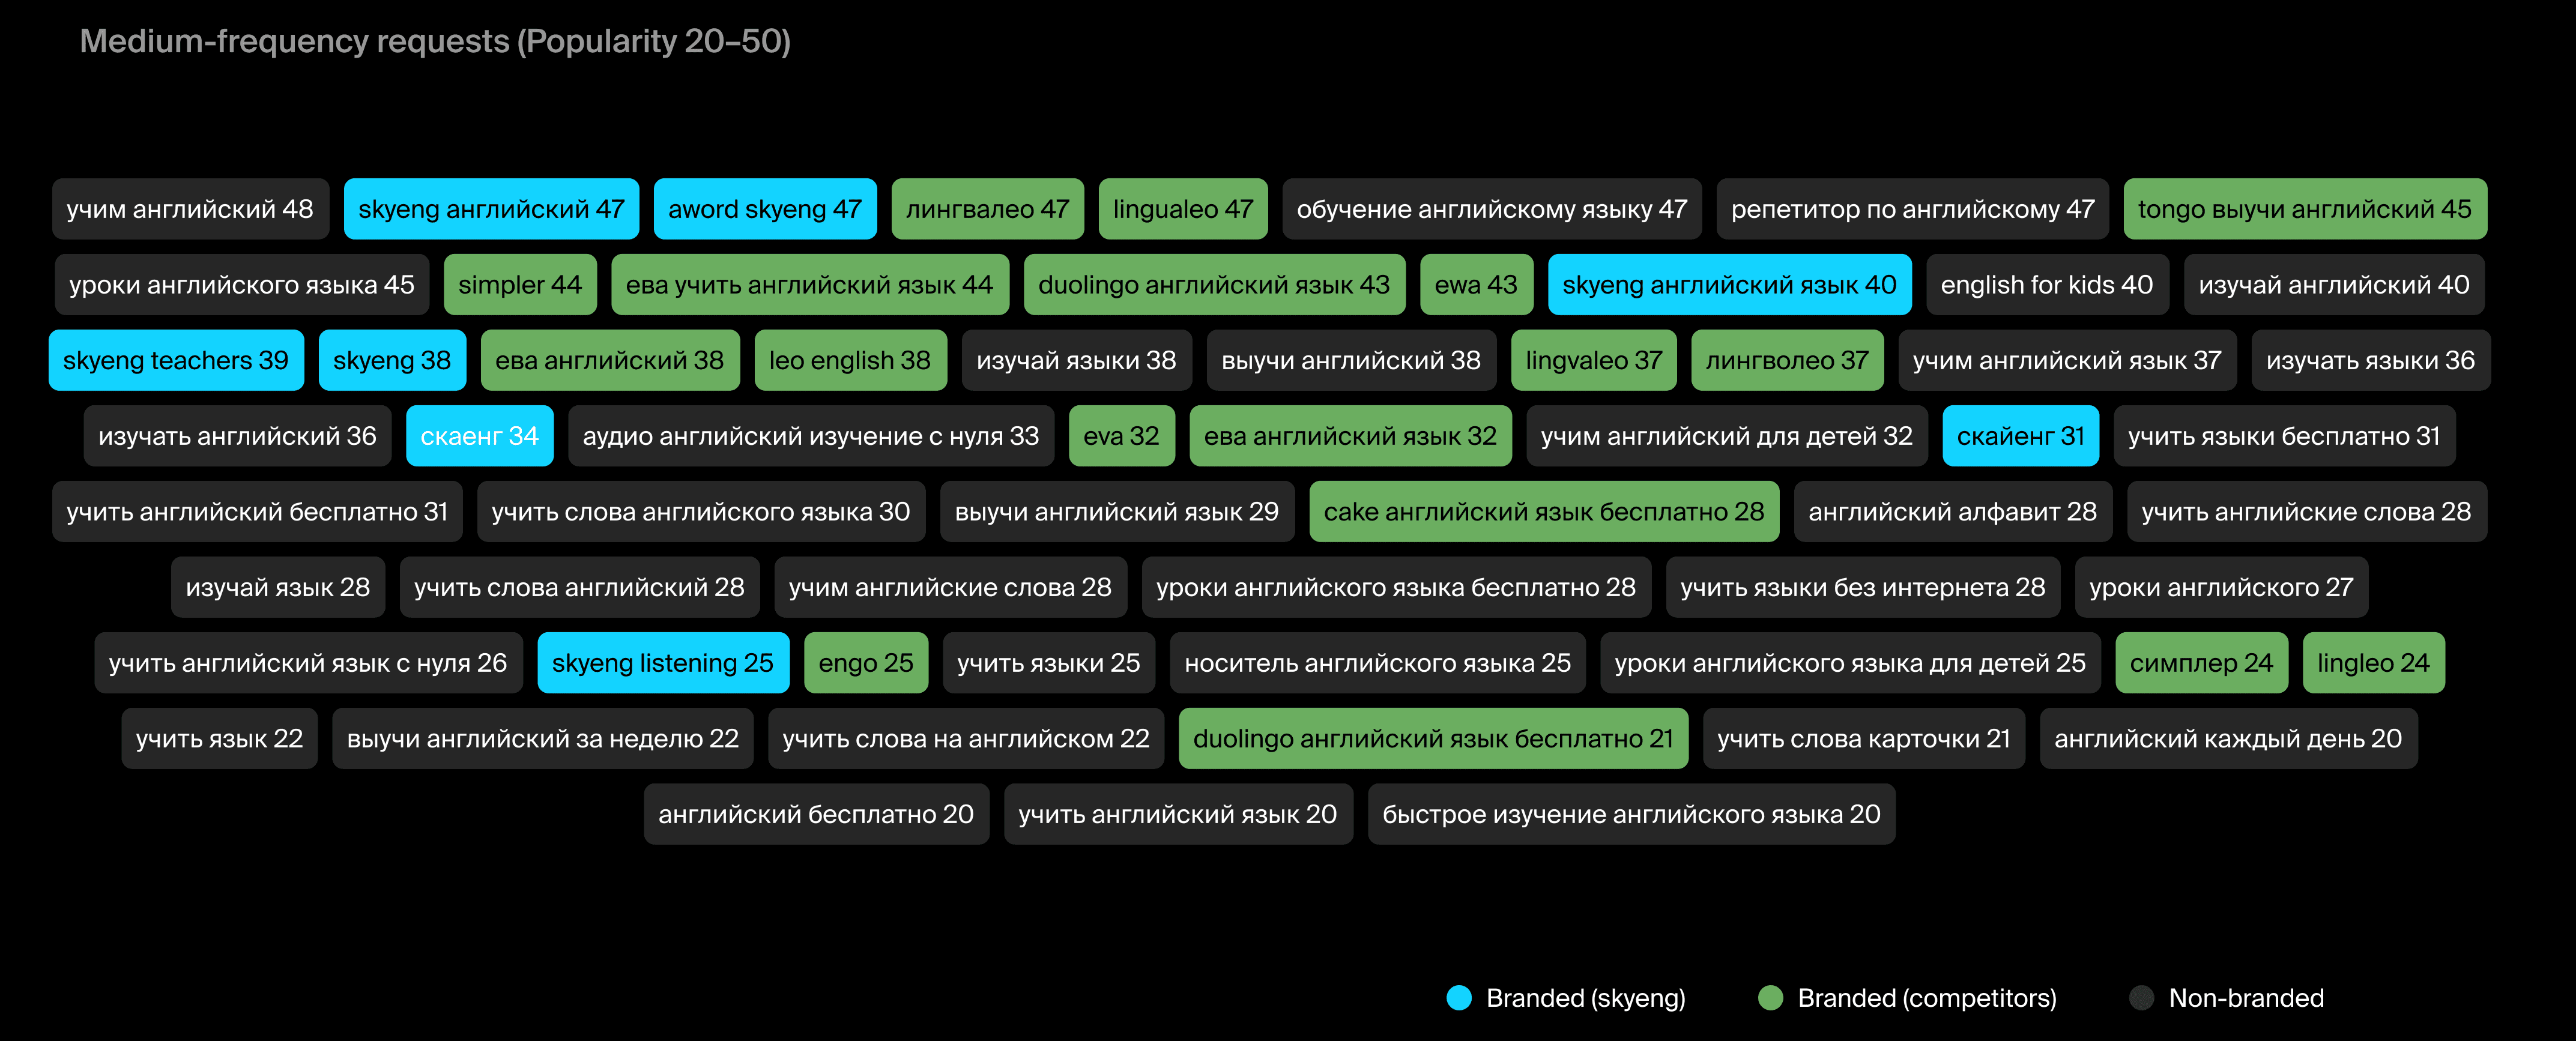
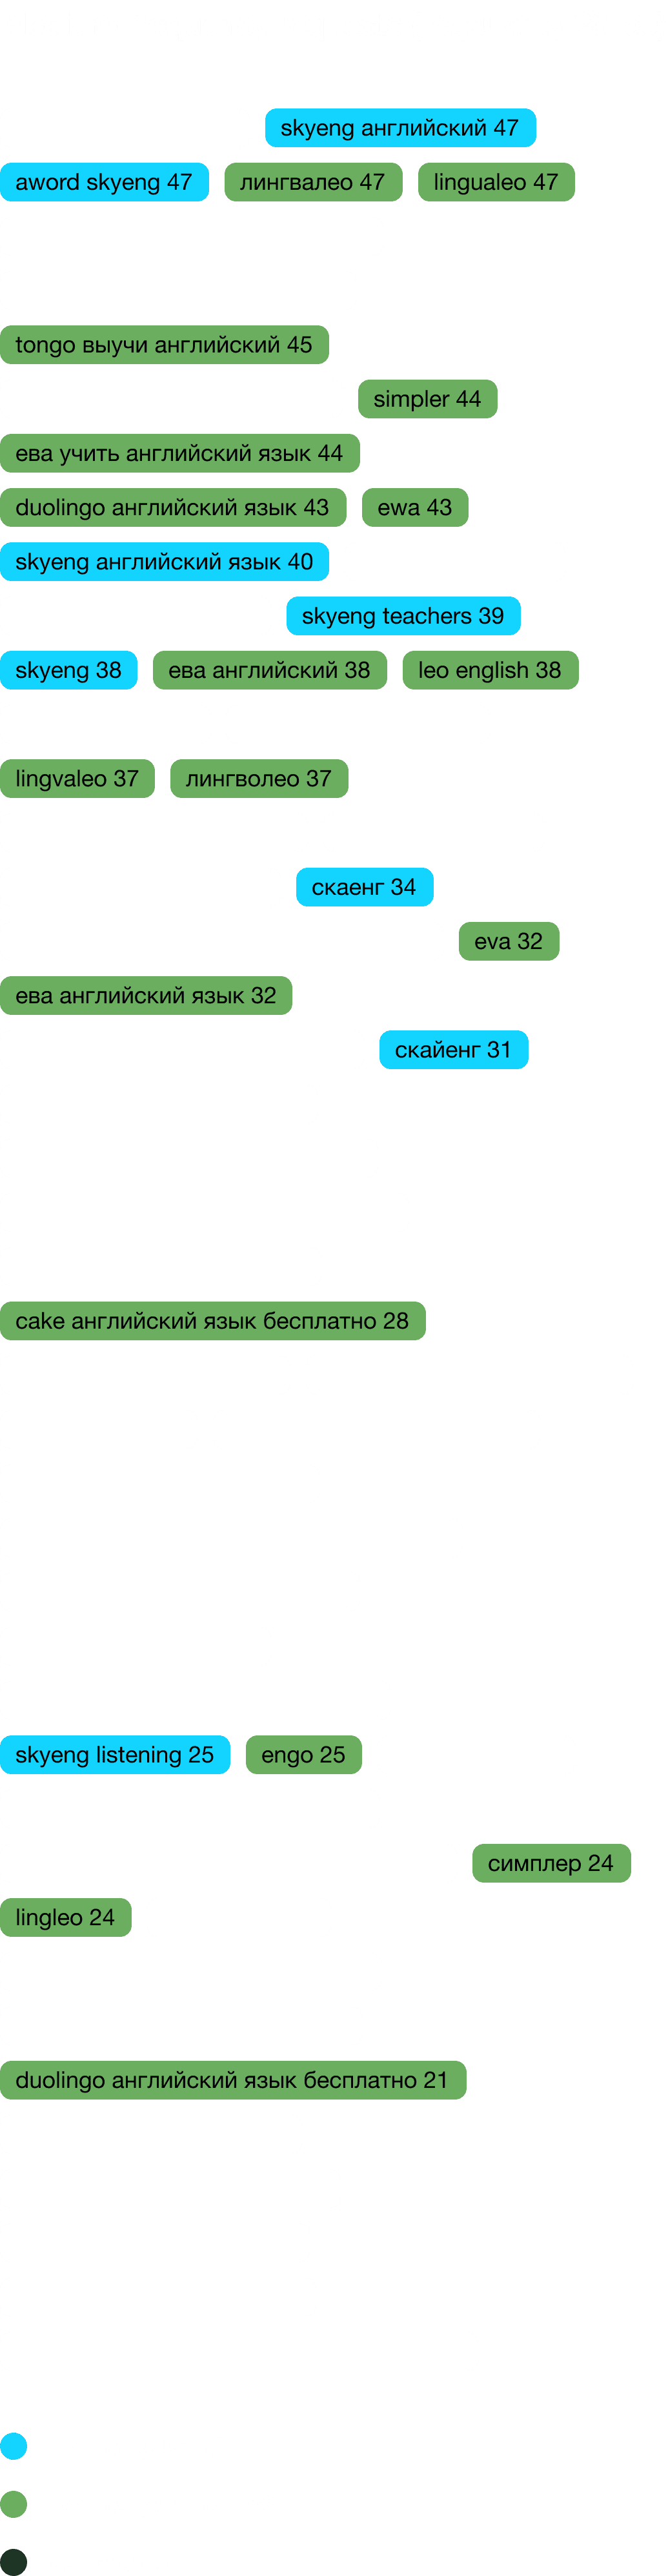
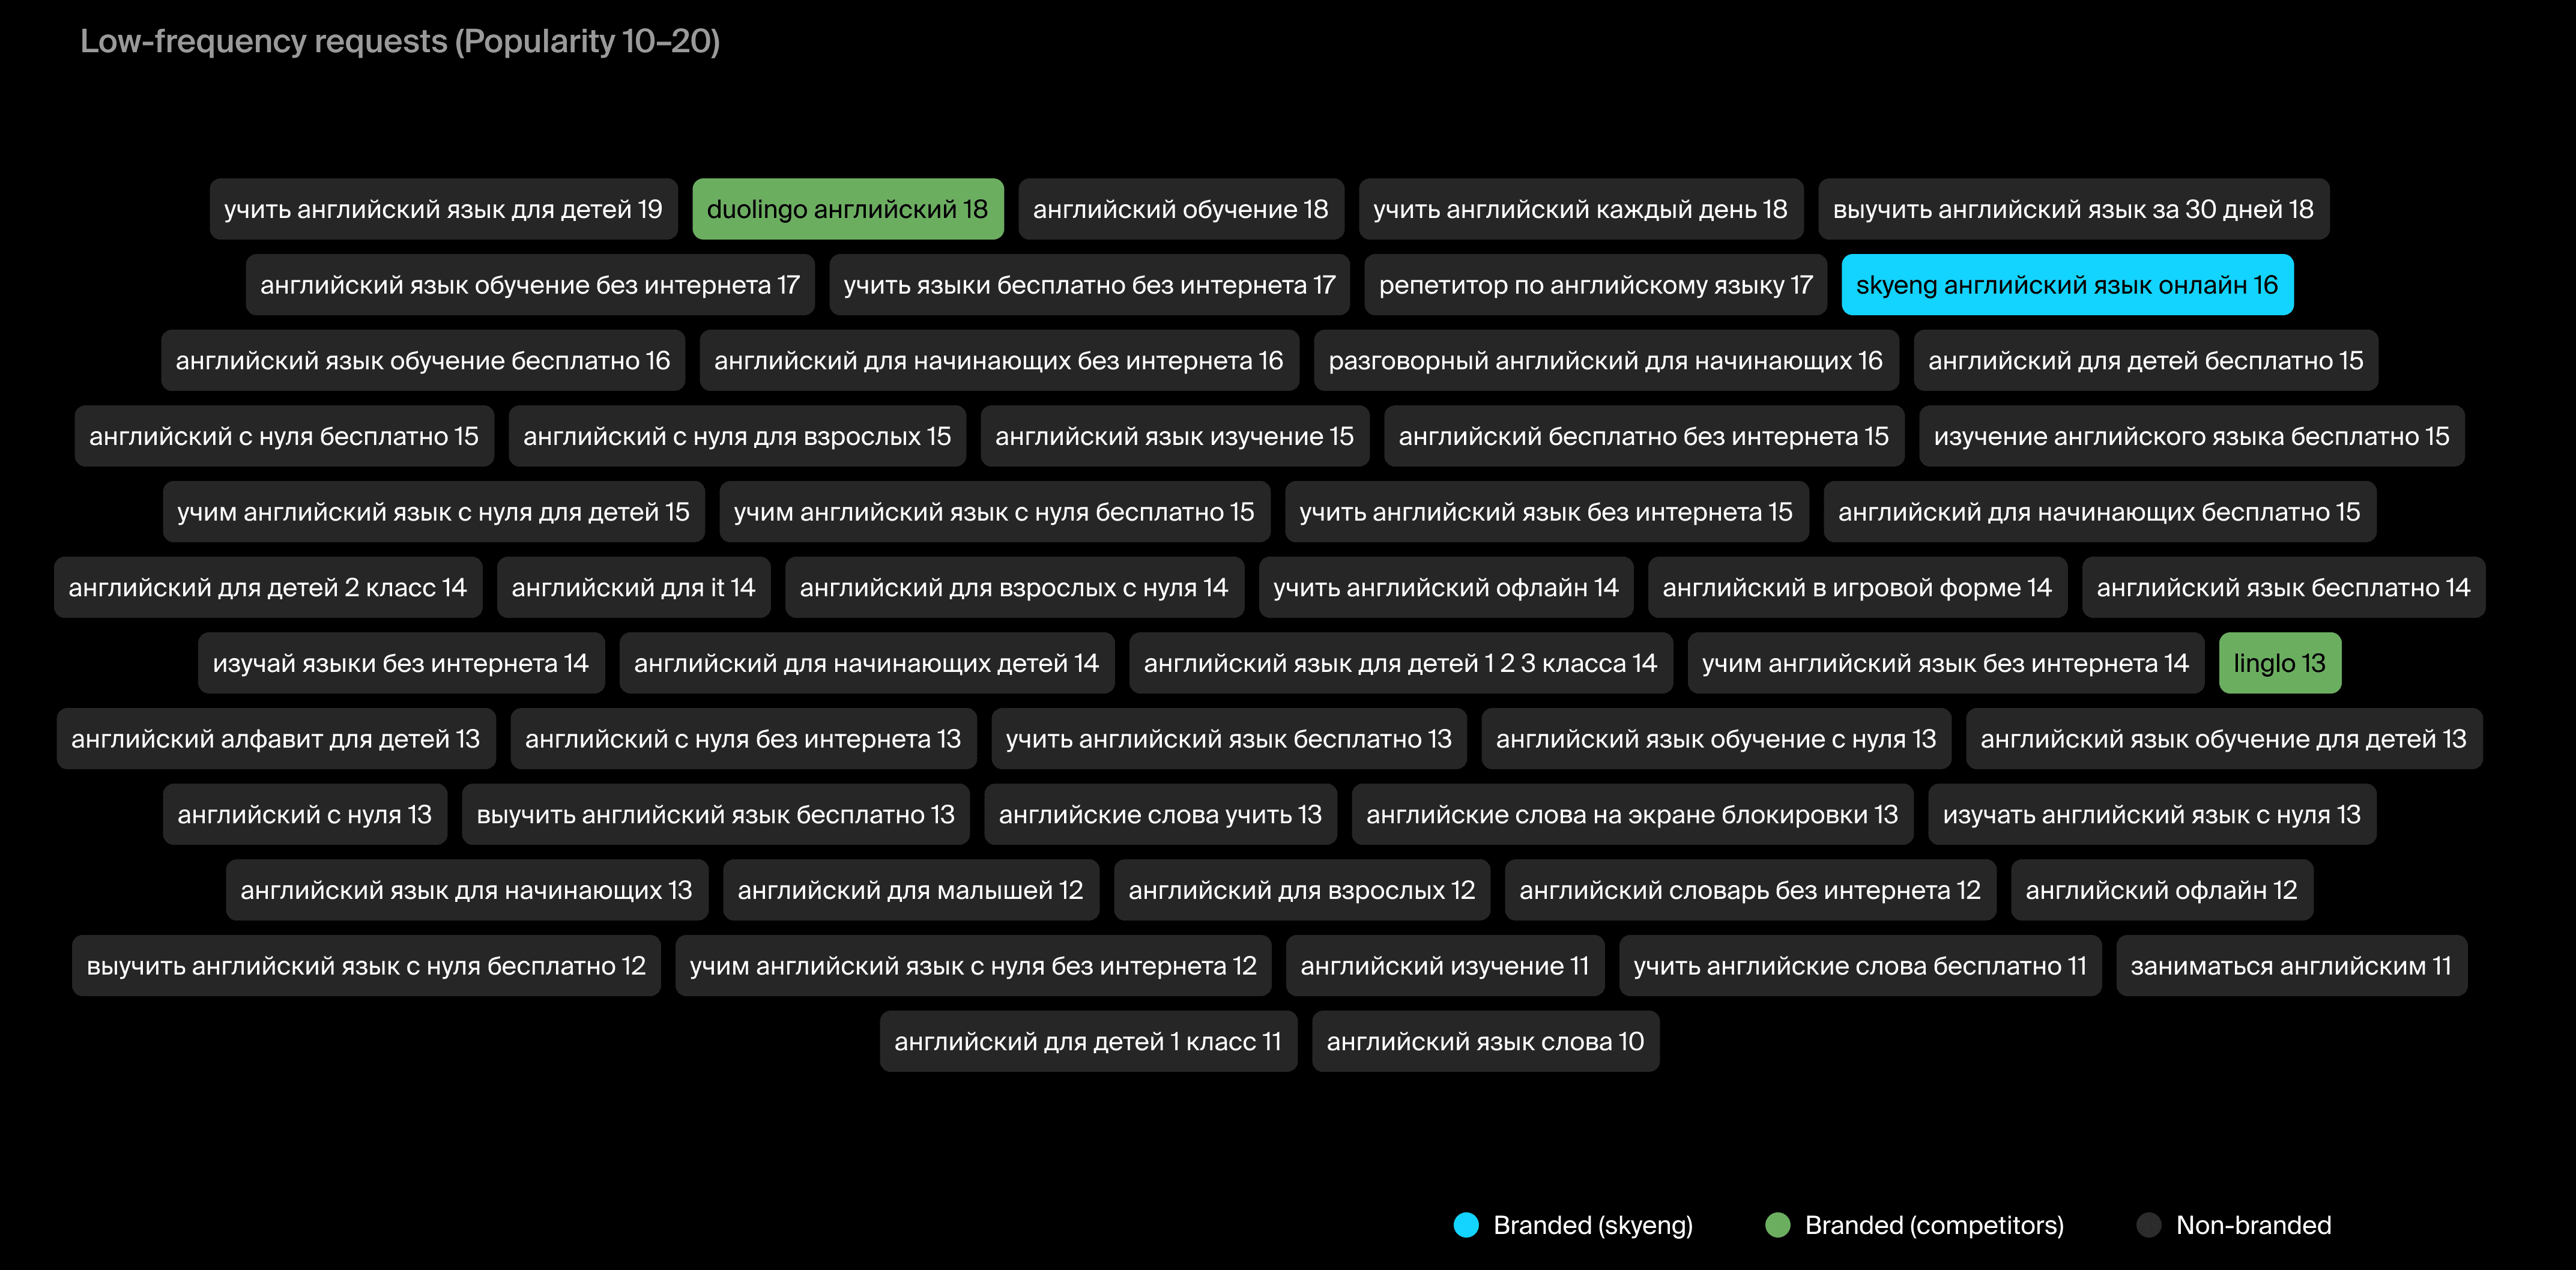
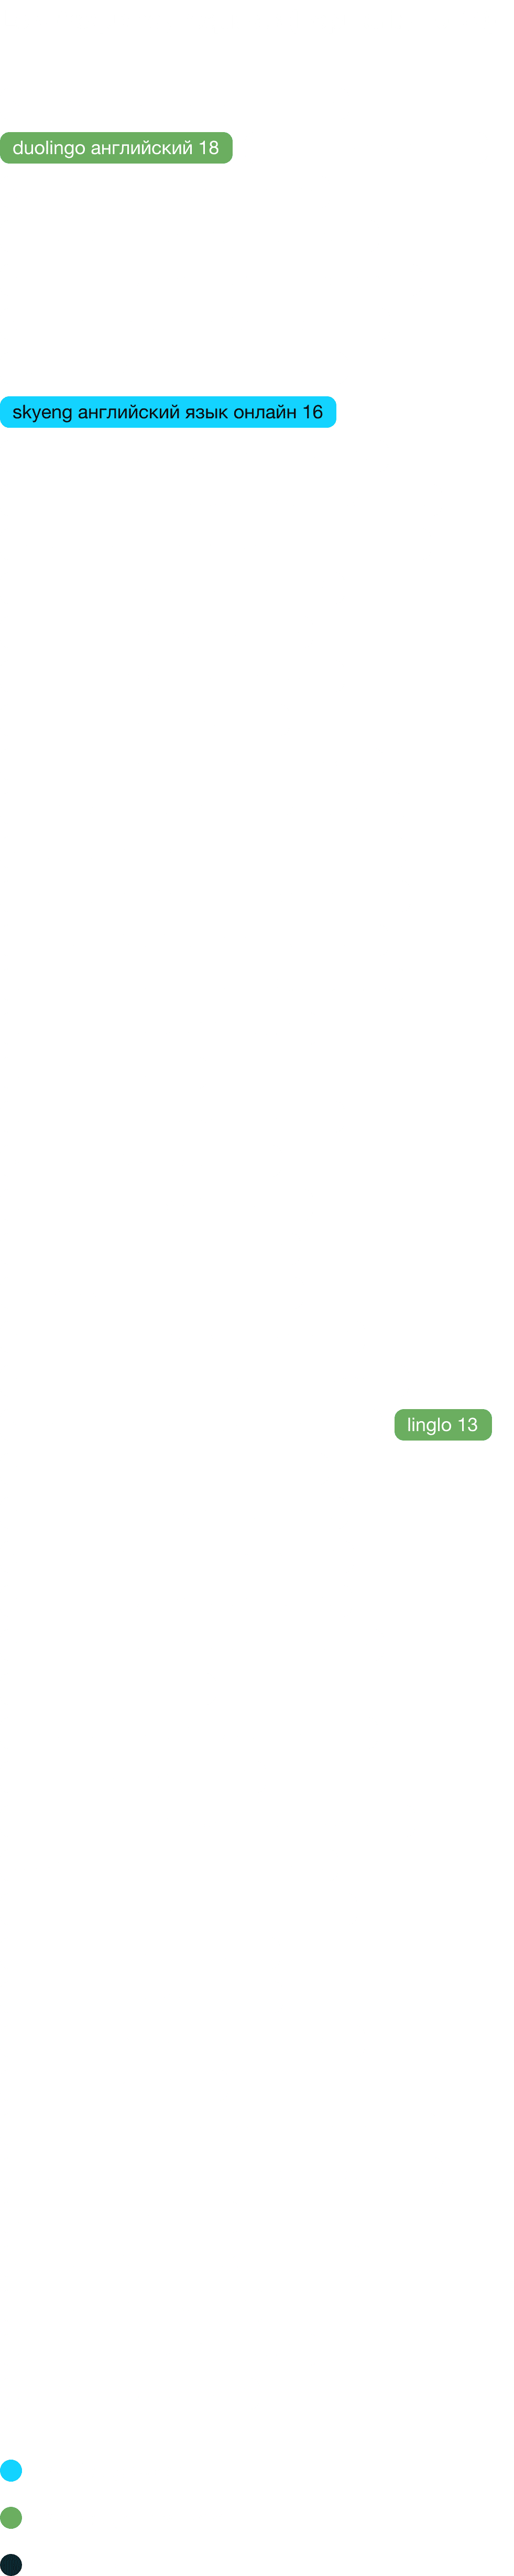
All semantics are divided into groups of search requests and sorted by Popularity*
Let's get back to the set of search requests. We see that the semantics is broad for non-branded search requests:
14High-frequency requests (Popularity > 50)
40Medium-frequency requests (Popularity 20–50)
52Low-frequency requests (Popularity 10–20)
170+Low-frequency requests with Popularity < 10
This means the potential of organic demand in the English learning vertical is high, while the apps holding top positions for these search requests receive most of the traffic. Now that we have the context of organic demand, we can move on to analysis and calculations.
Situation analysis
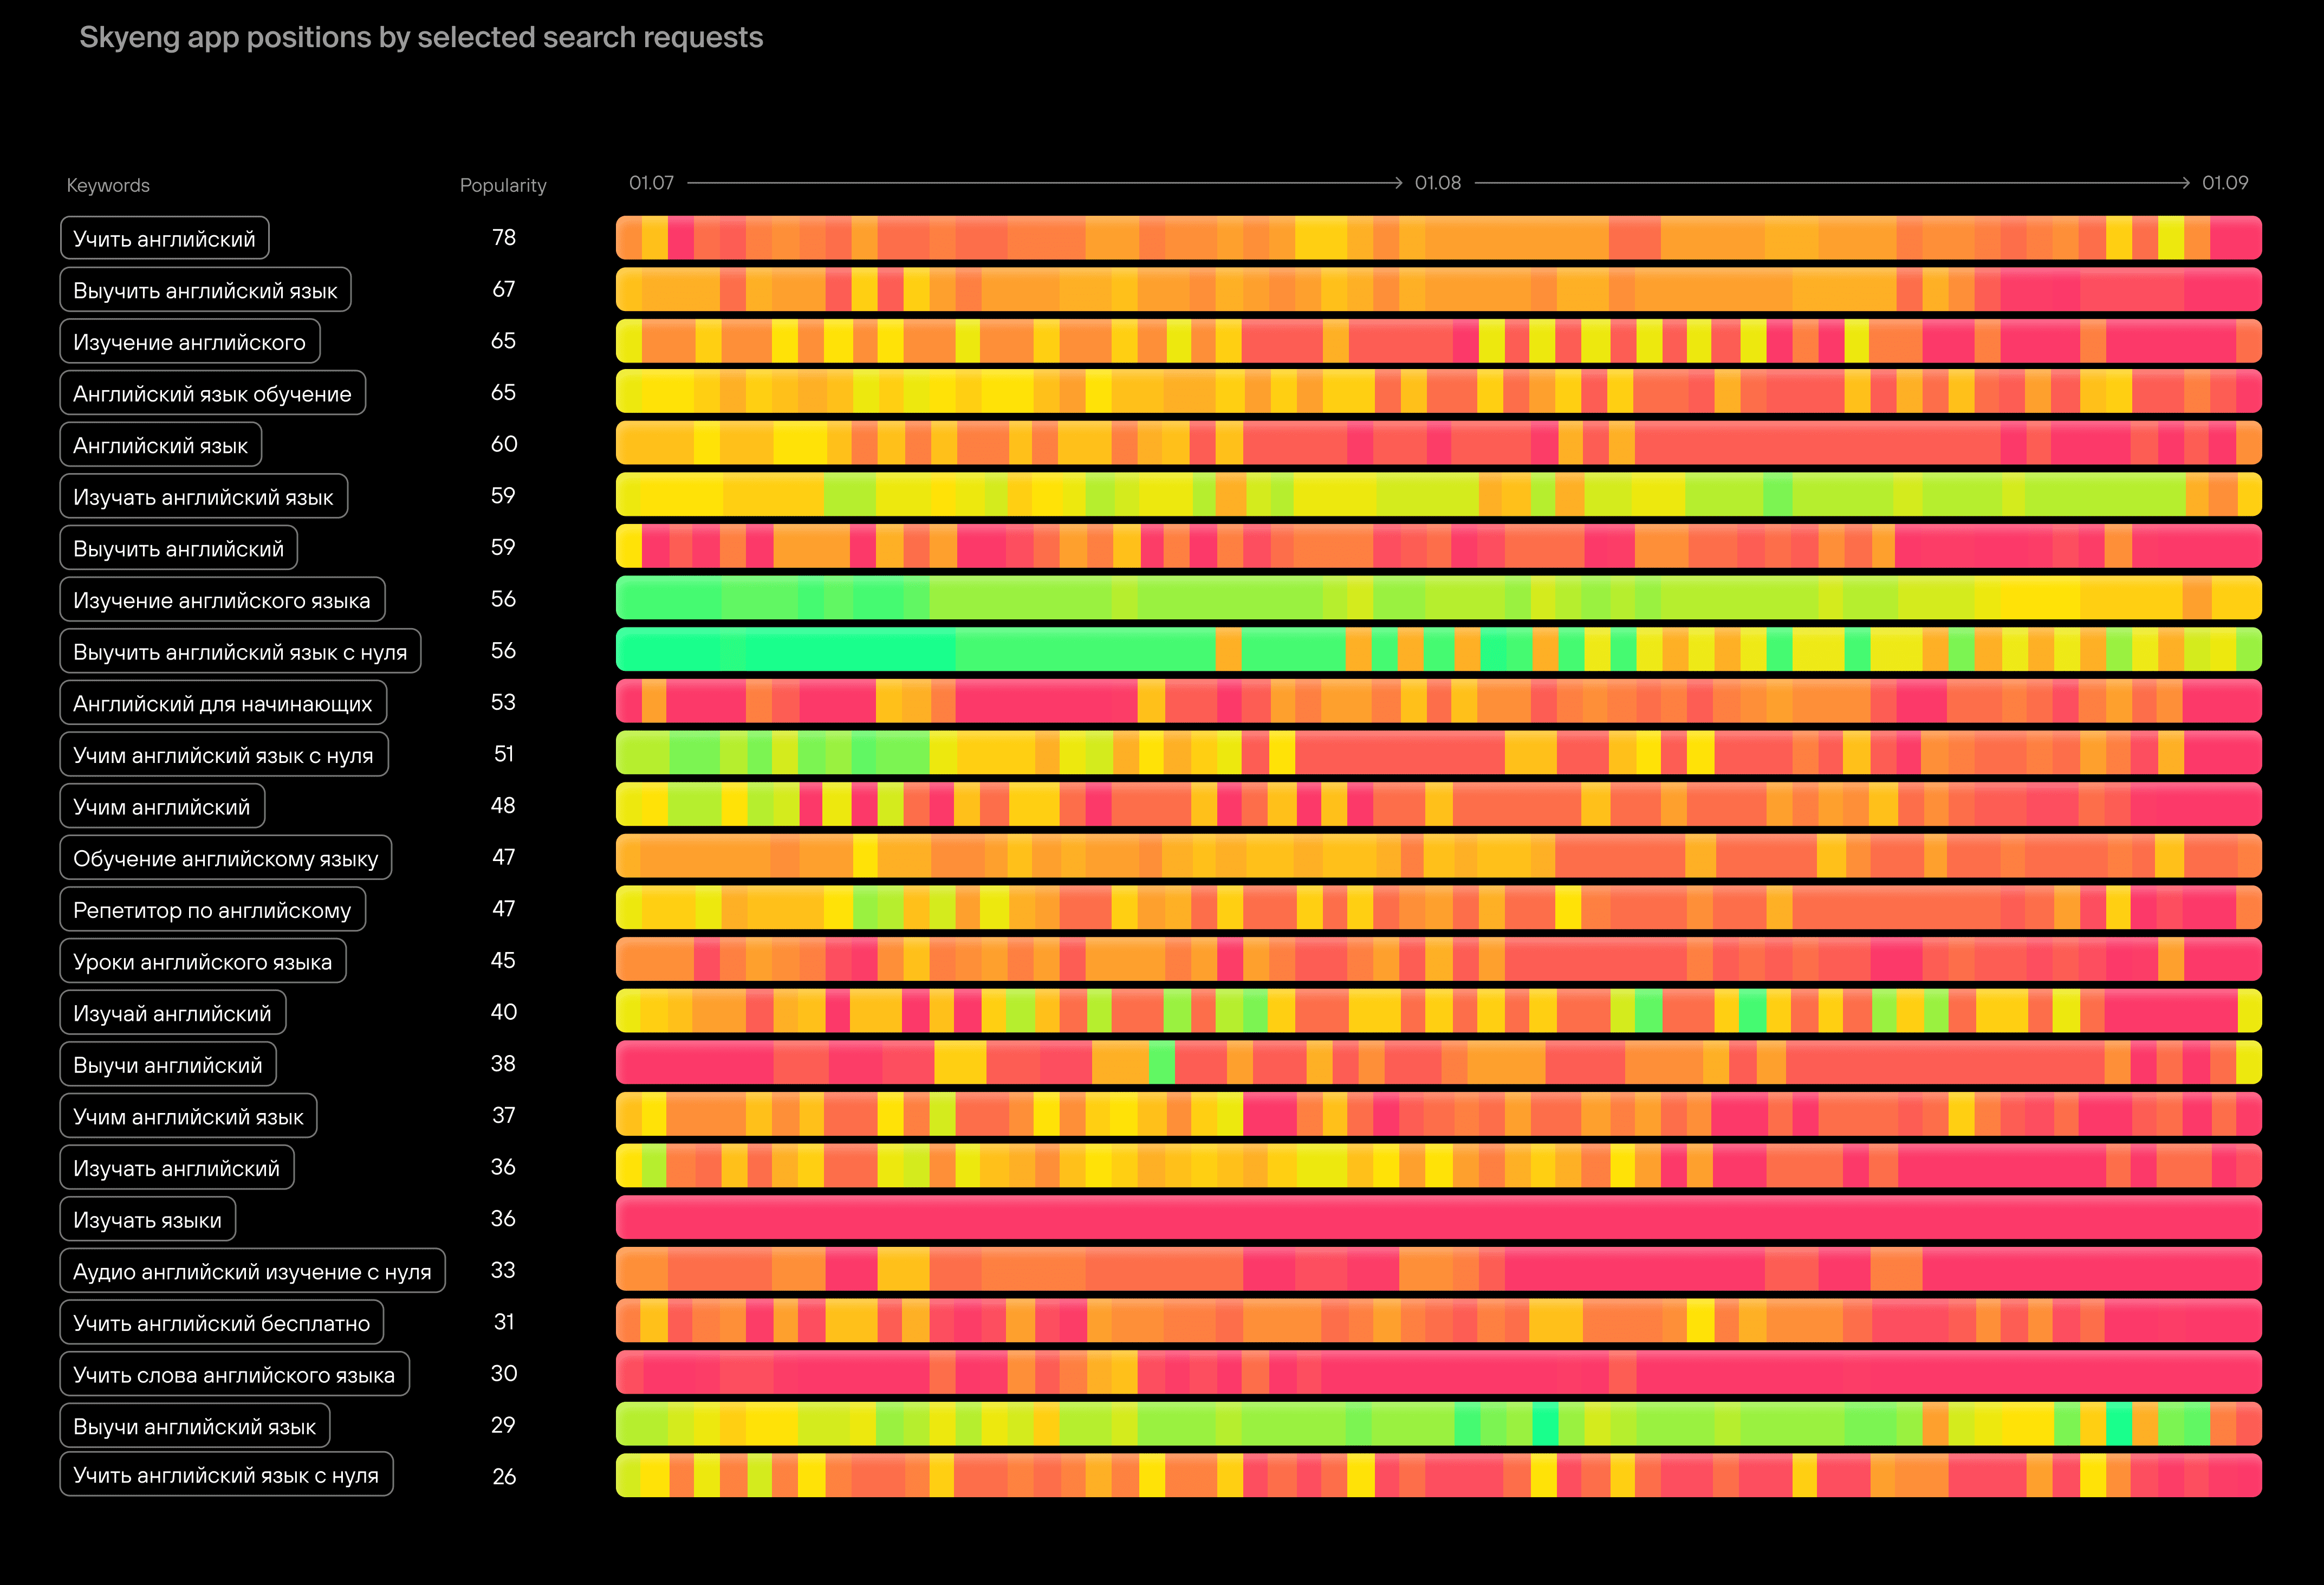
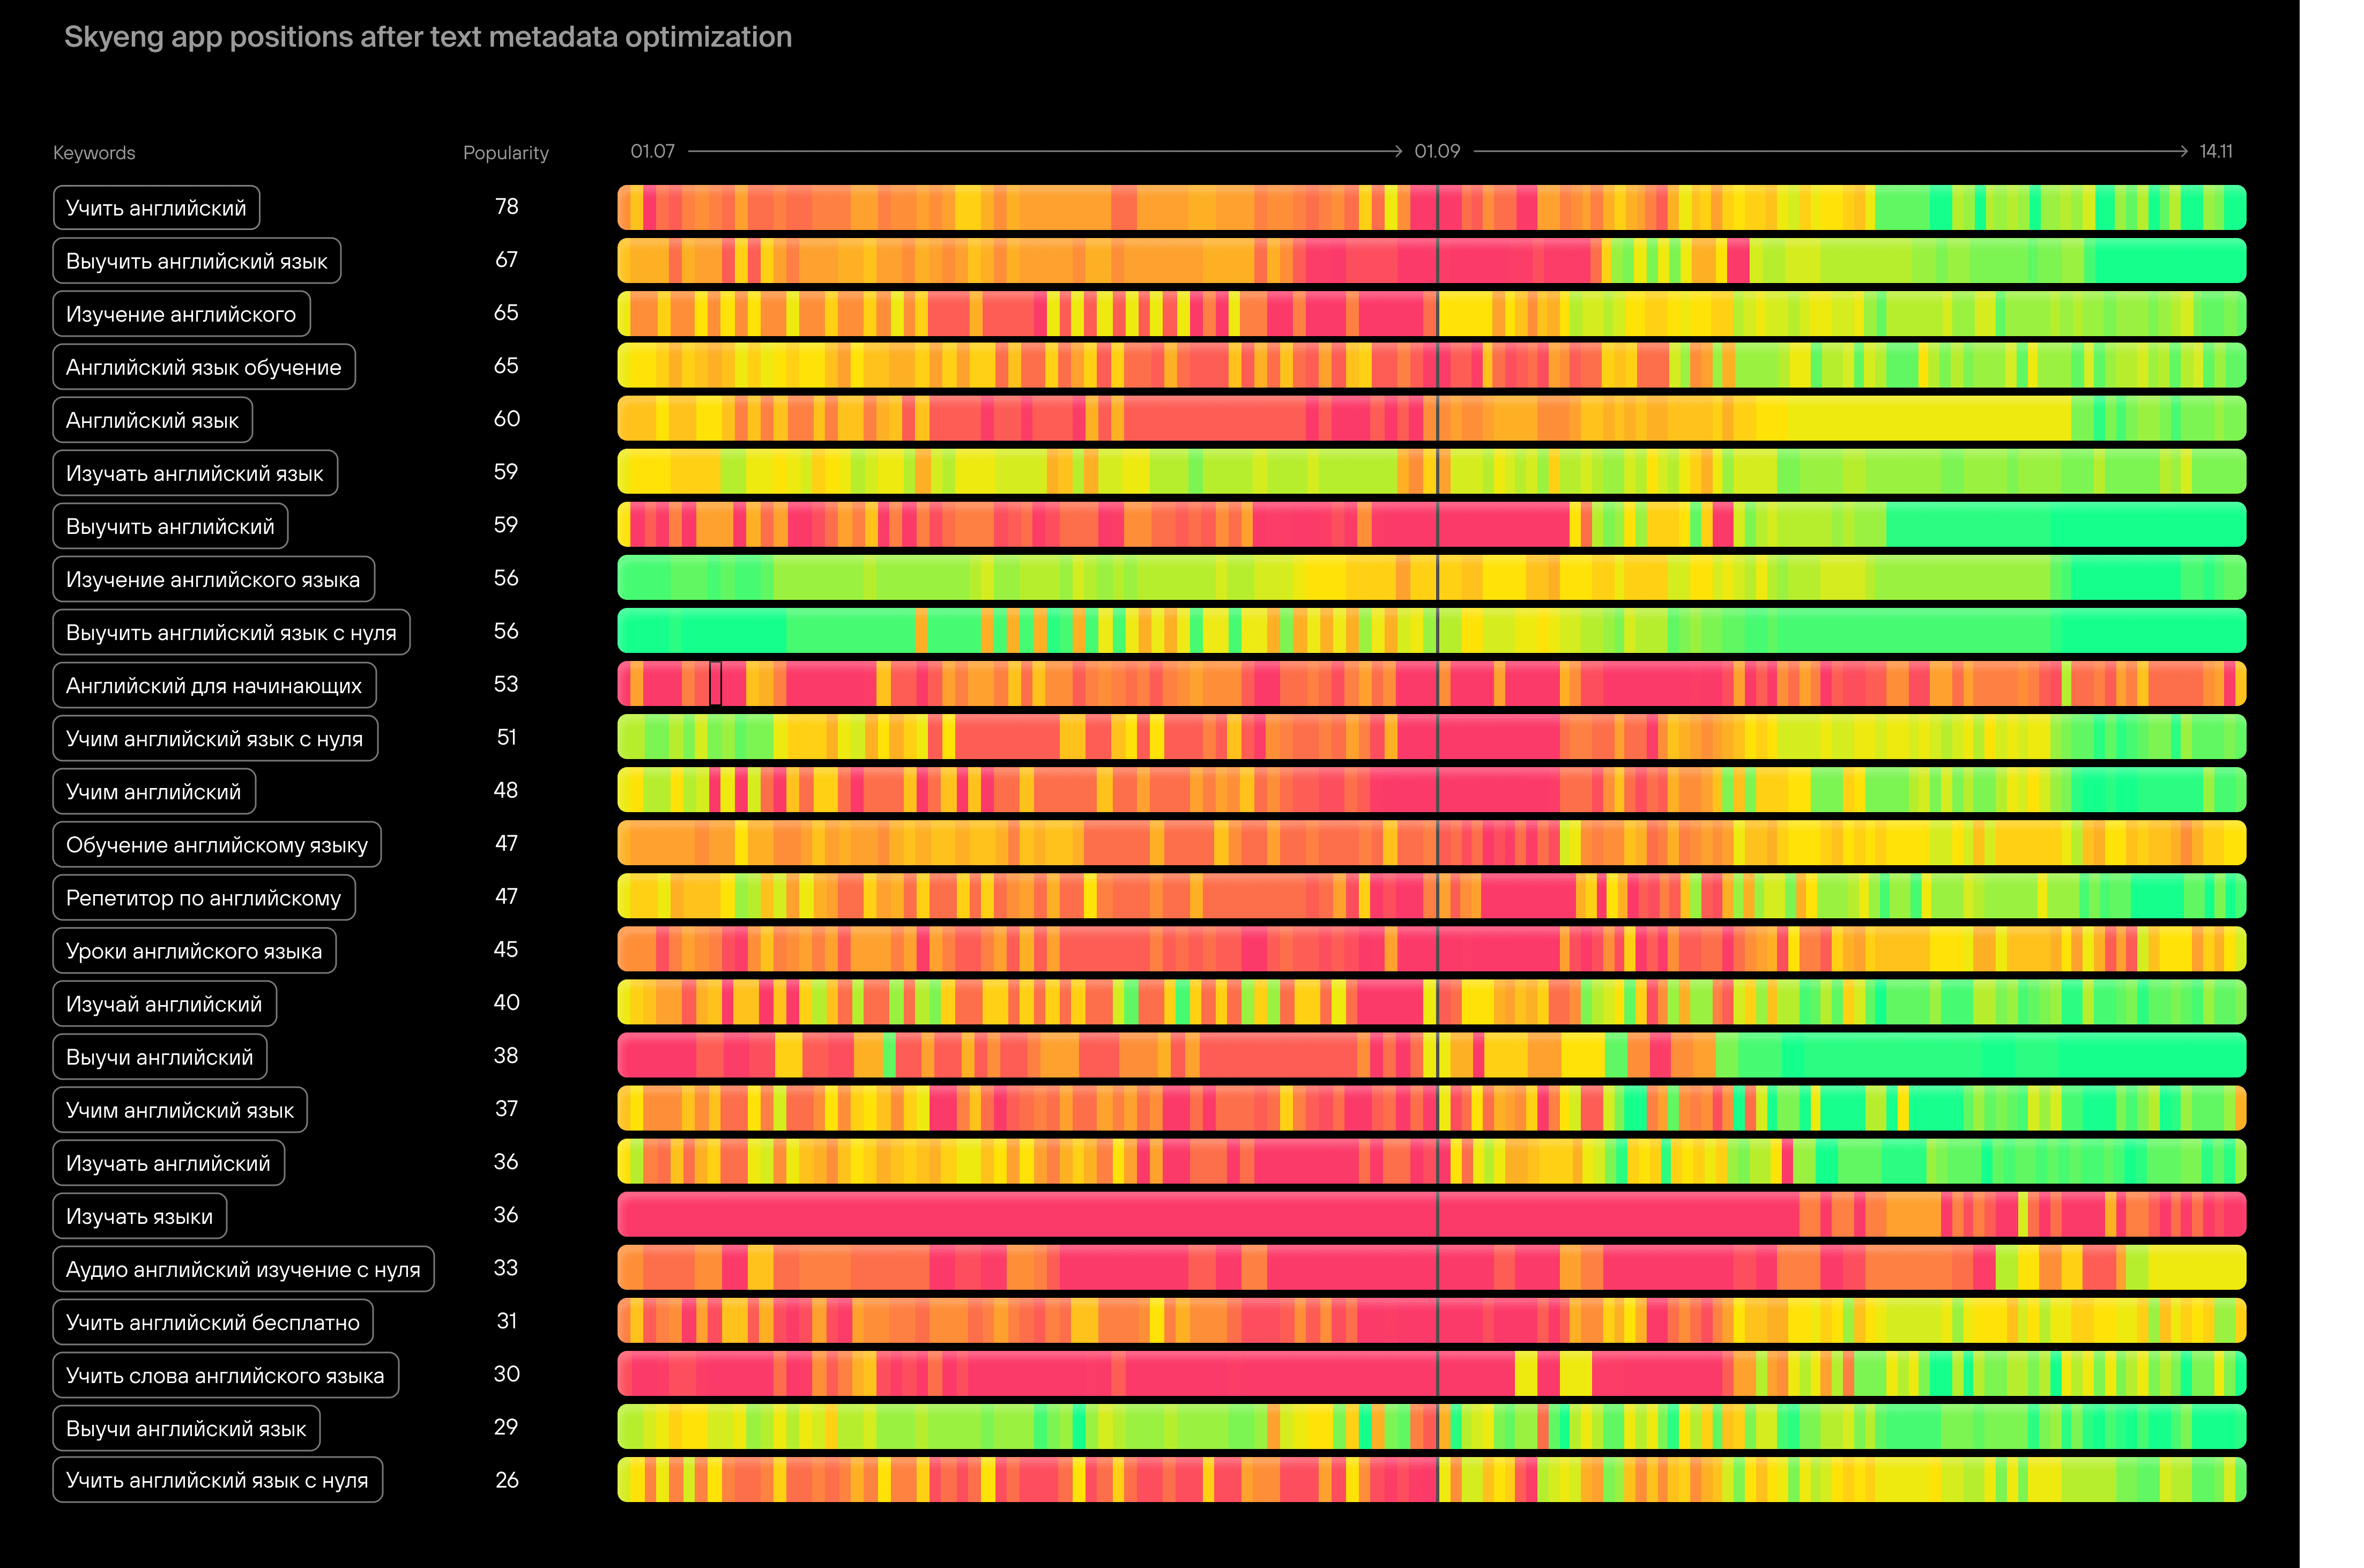
Let's take a group of 25 search requests with the highest Popularity value and look at the app's position for this group from July to September:
Учить английский
78
Выучить английский язык
67
Изучение английского
65
Английский язык обучение
65
Английский язык
60
Изучать английский язык
59
Выучить английский
59
Изучение английского языка
56
Выучить английский язык с нуля
56
Английский для начинающих
53
Учим английский язык с нуля
51
Учим английский
48
Обучение английскому языку
47
Репетитор по английскому
47
Уроки английского языка
45
Изучай английский
40
Выучи английский
38
Учим английский язык
37
Изучать английский
36
Изучать языки
36
Аудио английский изучение с нуля
33
Учить английский бесплатно
31
Учить слова английского языка
30
Выучи английский язык
29
Учить английский язык с нуля
26
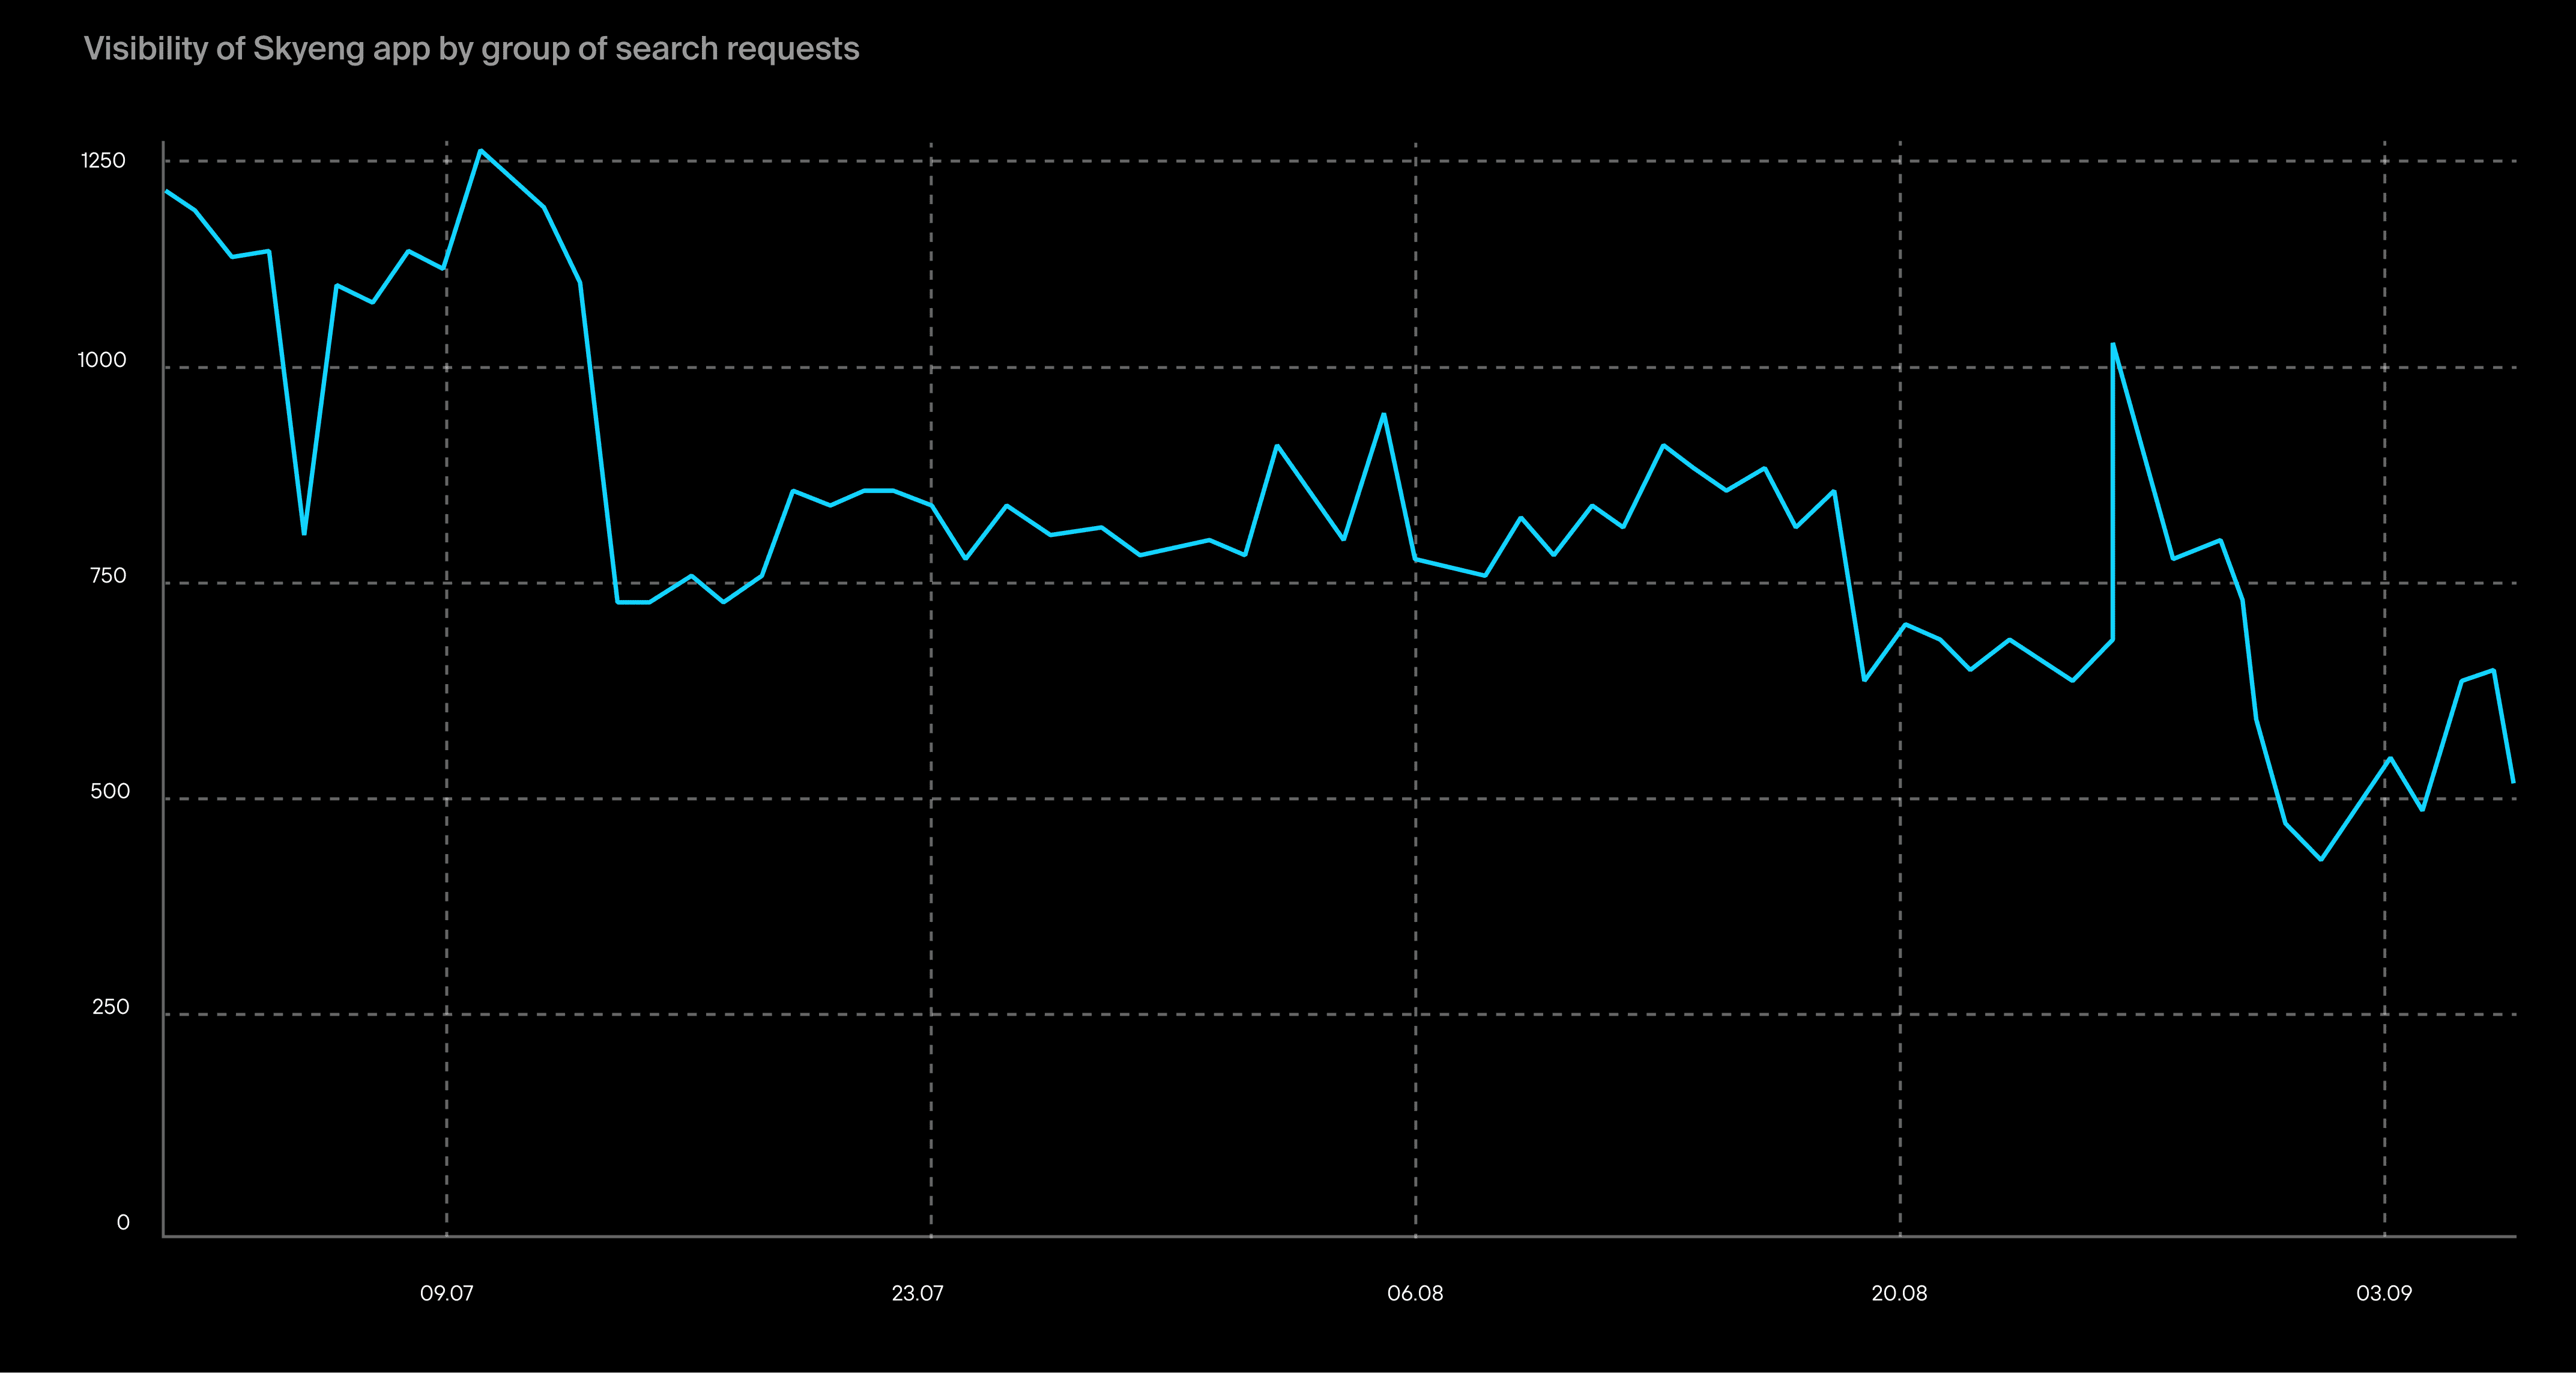
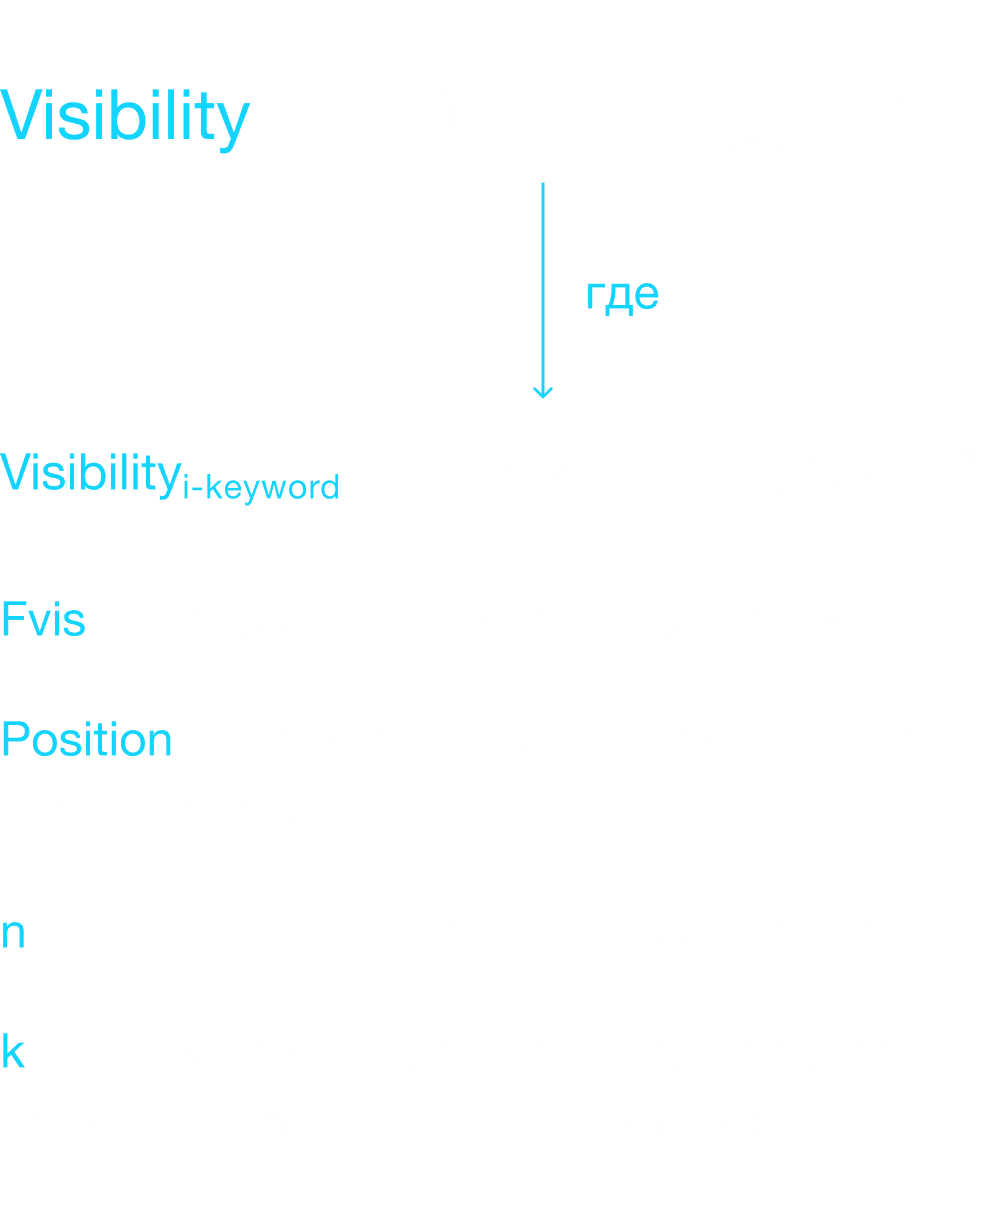
We see that Skyeng is losing its positions over time. To get a better visualization, let's use the Visibility indicator. This is a calculated metric that reflects the app's aggregate visibility across a selected group of search requests.
How Visibility is calculated
To assess the visibility of the Skyeng app, we investigated how the numbers of views and installs vary depending on the positions in search. Our experience suggests that this relation is well described by an exponential function, where about 60% of all views and installs are in the first three positions in the search results. To estimate Visibility, we empirically computed a function whose chart looks like this:Practice shows that data modeled by this function (see the chart) correlates well with the values of real cases. For example, we can see that the app loses a significant amount of traffic after dropping from the first position to the second. But the loss is not so great after the app moves from the eighth to the ninth, while the traffic difference between the 29th and the 30th positions will be insignificant. It makes sense, as very few users dive that deep into search results.
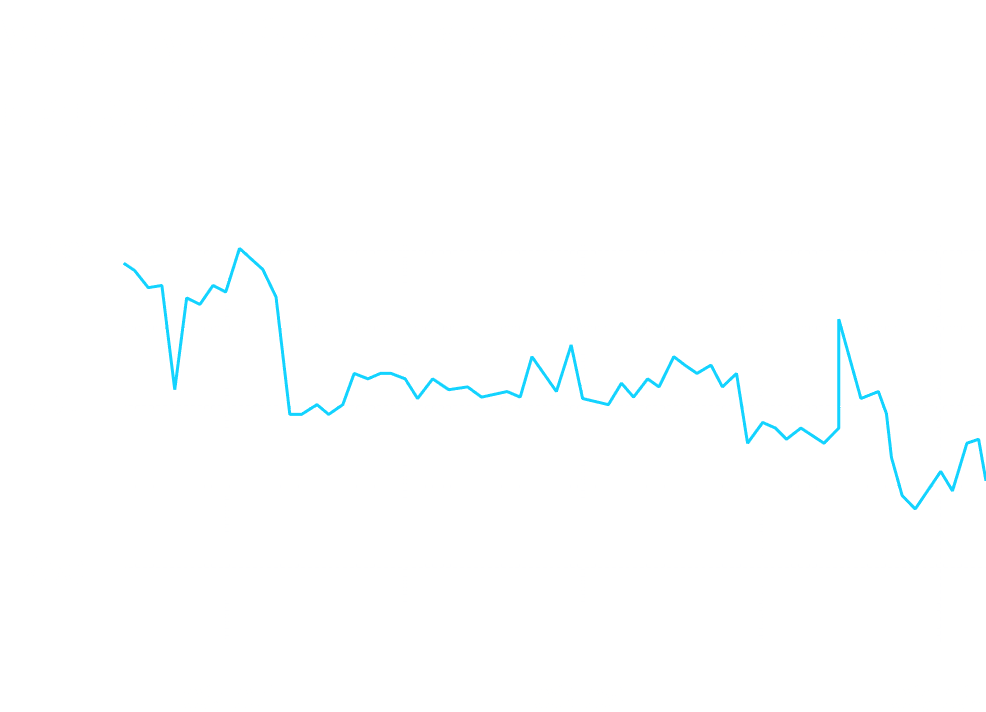
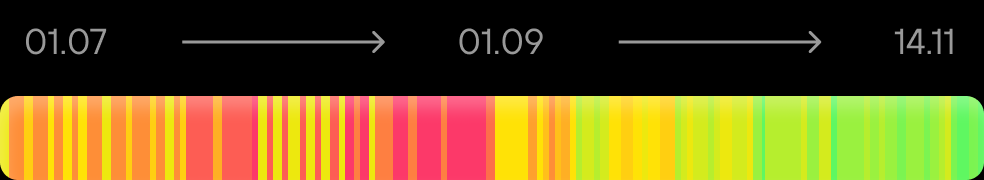
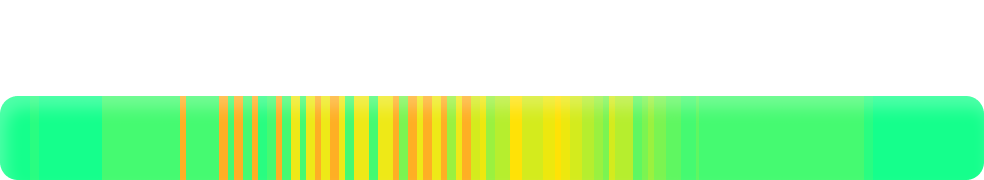
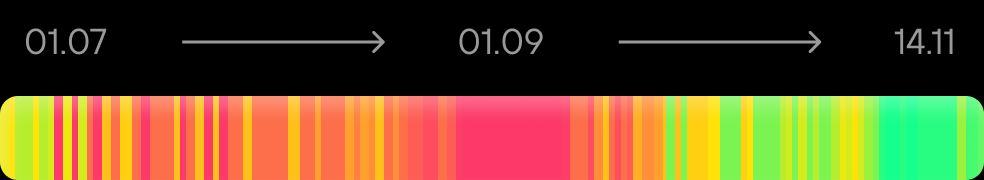
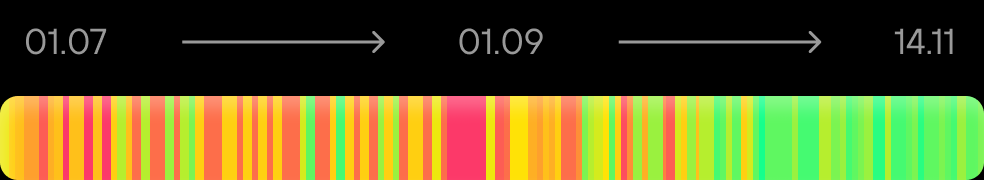
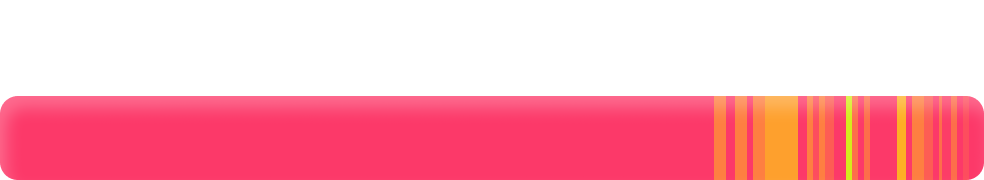
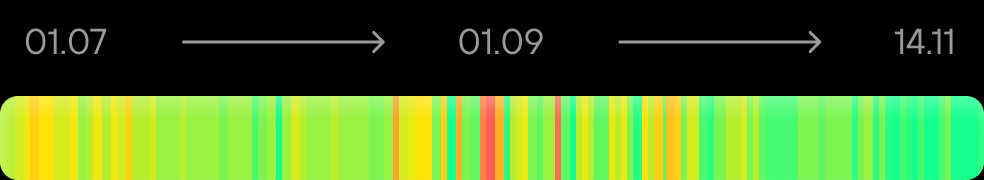
A prominent downward trend can also be seen in the chart displaying aggregate visibility by day. In late August, a few medium-frequency search requests made it into the top 5, while the rest of the search requests remained on average at a position below 10: this resulted in a small peak in visibility. After a small surge, the fall continued.
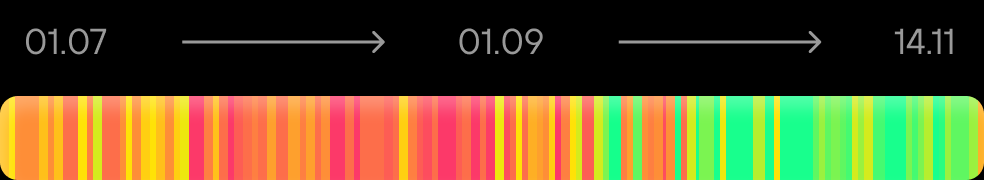
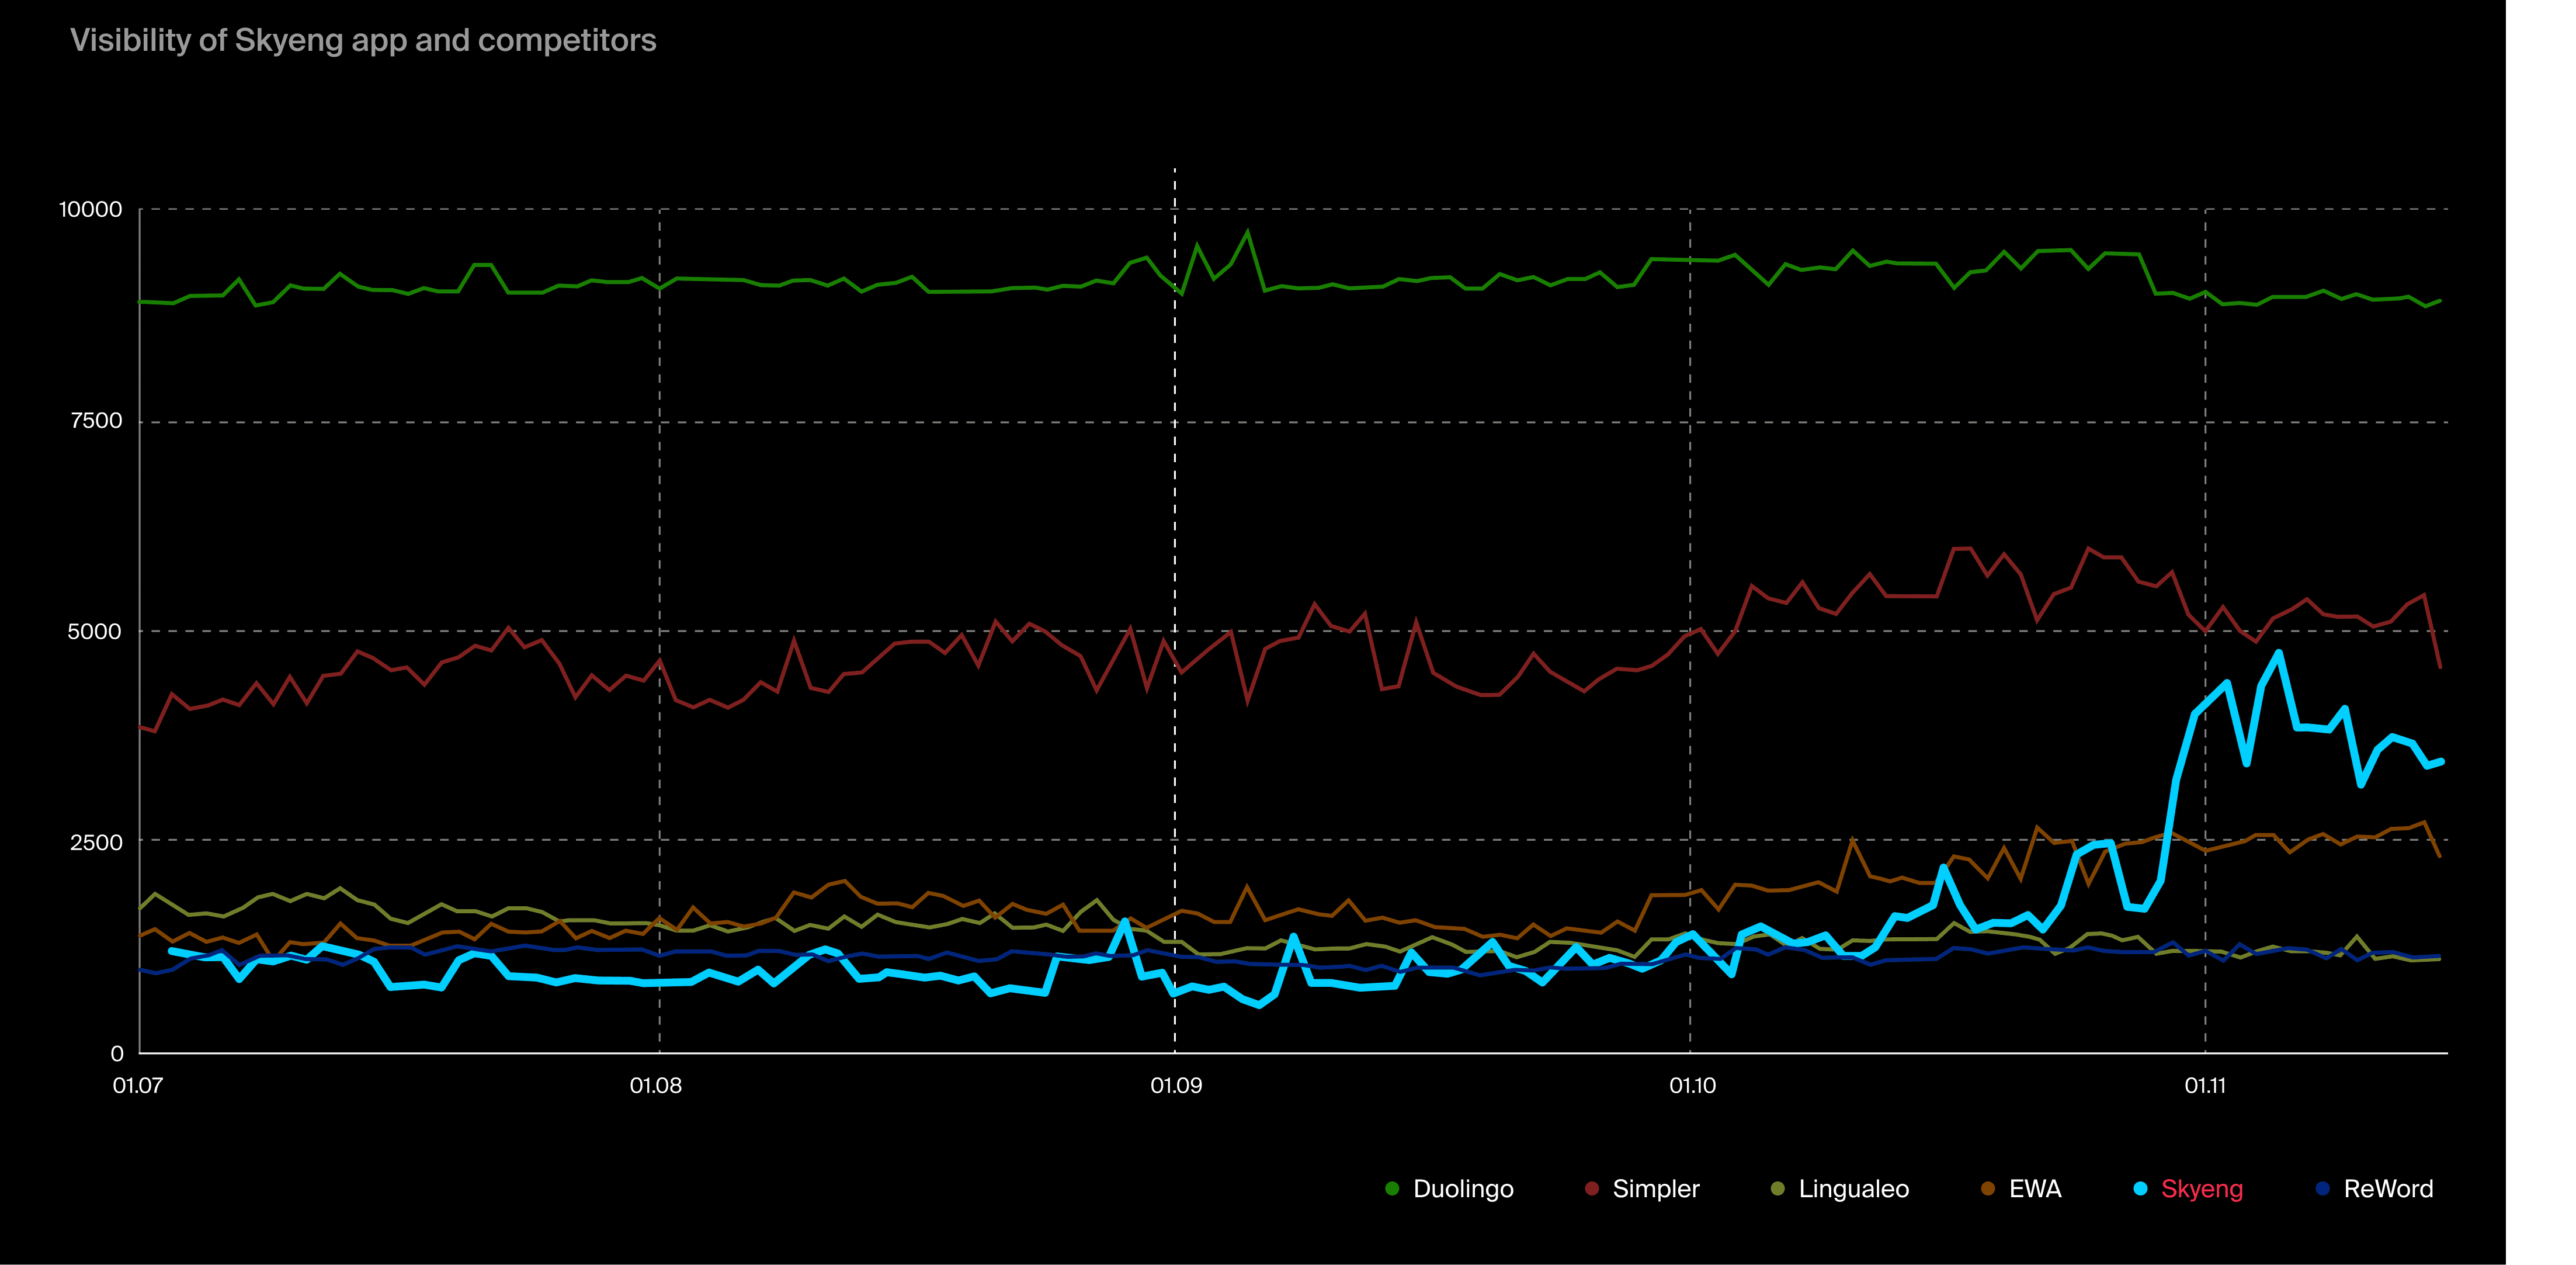
Now that we understand how views and installs vary depending on the app's position and Popularity, we can calculate the visibility index for each group of search requests:Apparently, the higher the app's position in search and the higher the query frequency, the higher the Visibility index. We used this indicator to get a better picture when promoting applications in search.Let's take another look at Skyeng's Visibility chart for the period when the project was losing its positions. But this time, we will add some competitors:
Even before the decline, Skyeng's positions in the most popular search requests could hardly be called high, so the decrease in Visibility does not look dramatic when compared to competitors. But here are some interesting takeaways from the chart:
First, the competitors have stable performance in terms of this indicator. There are some increases and drawbacks of Visibility, but the whole picture seems smooth.
Second, there is a prominent leader in the category, the Duolingo app. It was in the top 3 for almost all of these search requests, which accounts for this high visibility score.
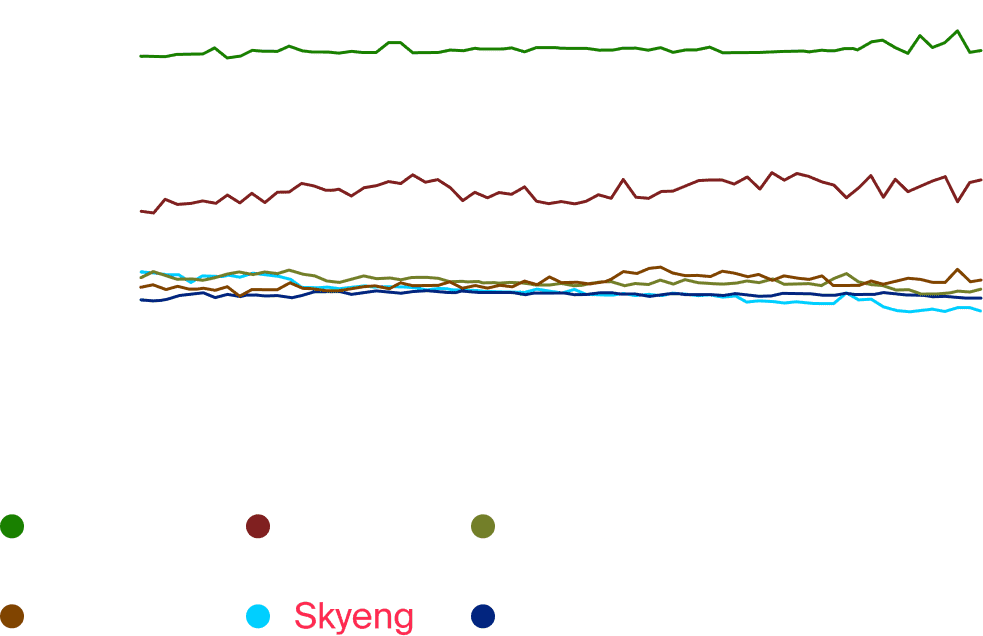
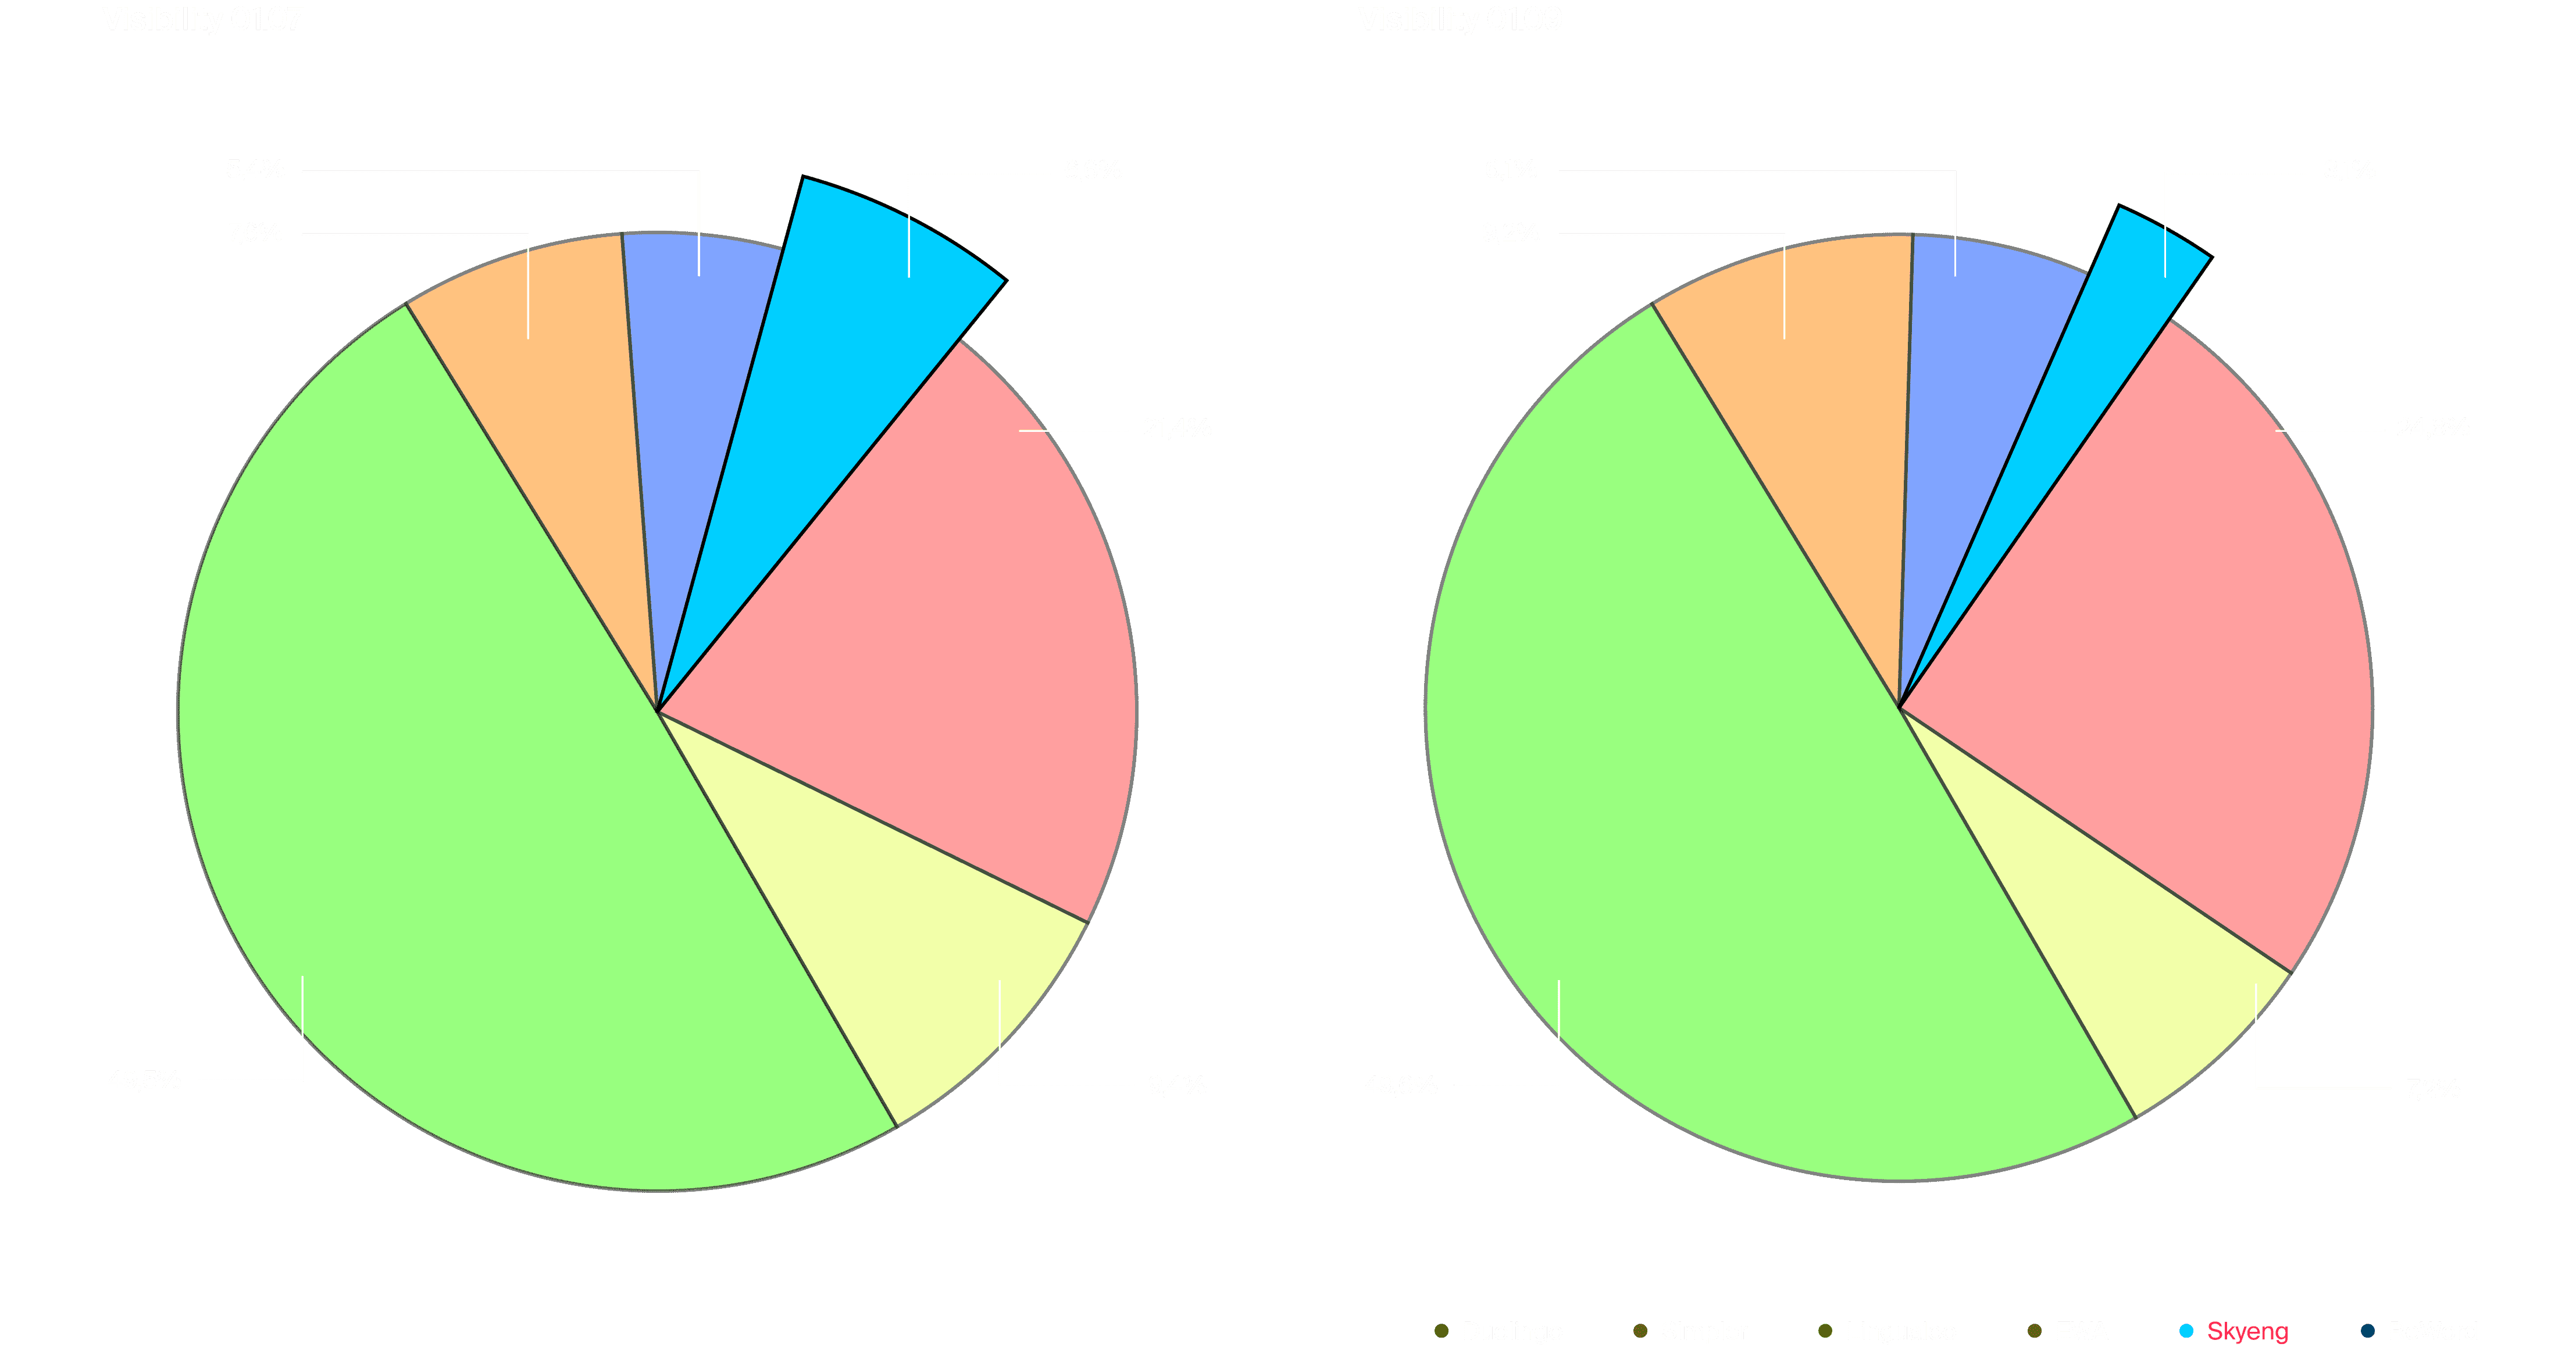
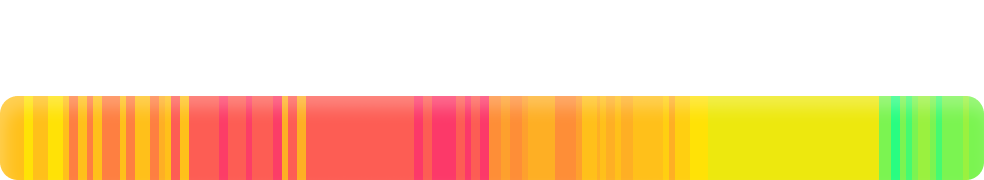
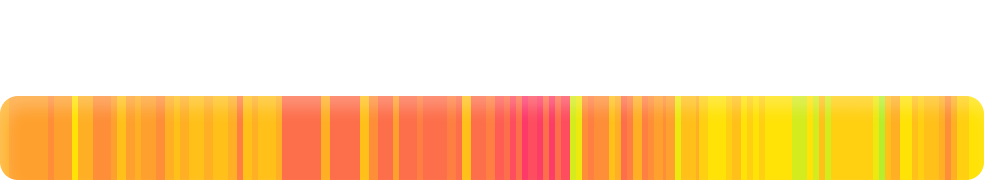
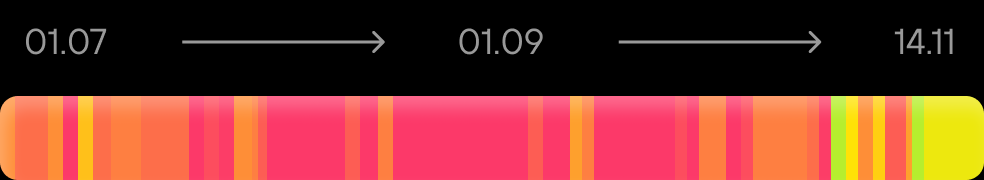
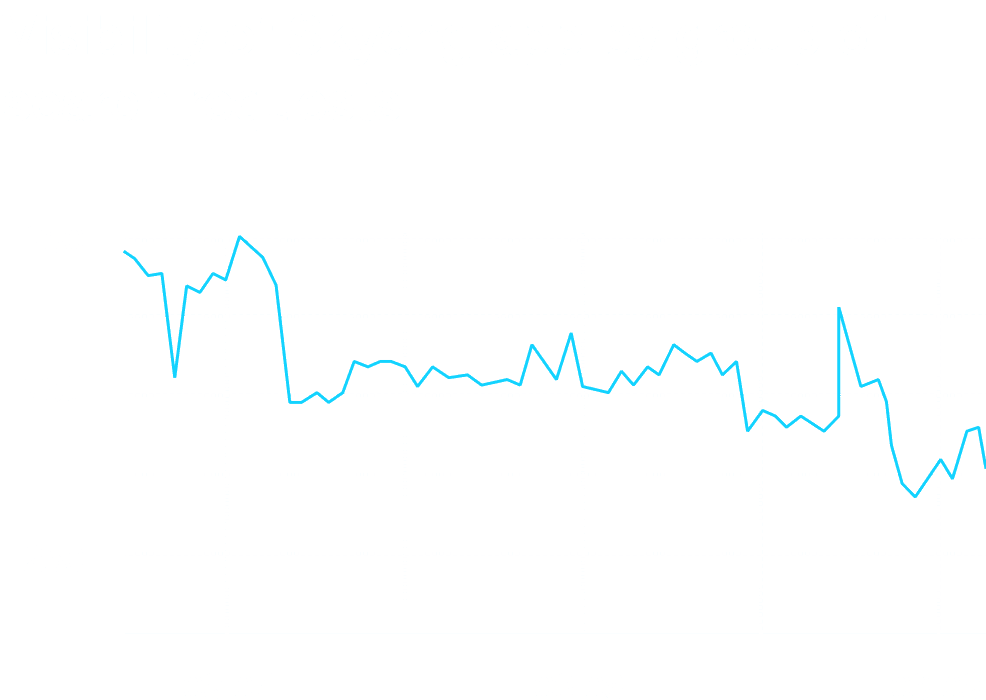
To compare the start and end points in these charts across several applications, we plot two slices as pie charts:We can see that the situation is not very favorable for Skyeng. Visibility against the competition wasn't very high before the decline, and shrank to 3.1% within two months. This data demonstrates the available potential that we can win back from other apps.Now let's examine Skyeng's organic installs chartWhen an app's position drops and visibility decreases, it's reasonable to expect fewer installs as well. We can't share the exact number of installs in this case, but we will showcase the dynamics in the chart, so you can see a general trend:
Why doesn't the installs chart fully correlate with the Visibility chart?We must note that the installs chart doesn't fully correlate with the Visibility chart. The fact is that the visibility score is based on an estimated popularity value, and this adds a margin of error. It's also unknown how accurate the request attribution by Google Play Console analytics is. Nevertheless, the correlation between Visibility and the number of organic installations is well observed, which means we can use this indicator, among other things, to assess the situation and estimate the effectiveness of future hypotheses.
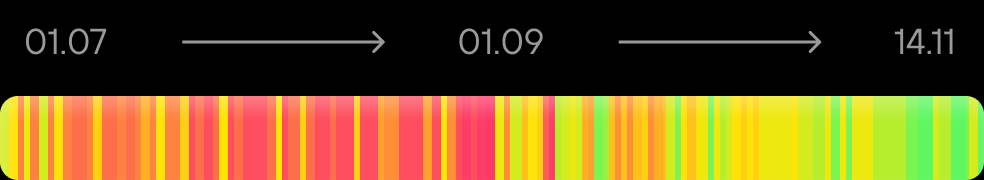
This chart shows a relation between the app's positions and organic traffic volume. The same 25 most popular search requests were taken for evaluation.Decreasing installs was the central problem we had to tackle. But before doing anything, it's important to look into the possible causes to better understand exactly where the problem lies and then outline the hypotheses.So, the most significant problem we've faced was a decline in the number of installs. To solve the problem efficiently, we need to do some research and find out the possible reasons for such a decline. Only then can we put forward the hypotheses and start developing the solutions.
Figuring out possible reasons
As with request frequency, Google Play does not explicitly disclose the algorithms for ranking apps in search, but a few basic parameters are known:
Install Rate (the ratio of in-store views to installs, also as a factor affecting the item above).
Installs in a period (from search and total).
Relevance of textual metadata (can affect indexing and elasticity of growth in terms of search requests).
ASRM (App Store Reputation Management): total rating, number and scores of ratings, reviews.
Good metrics of some behavioral factors (such as Retention Rate) also have a positive impact on growth in search.
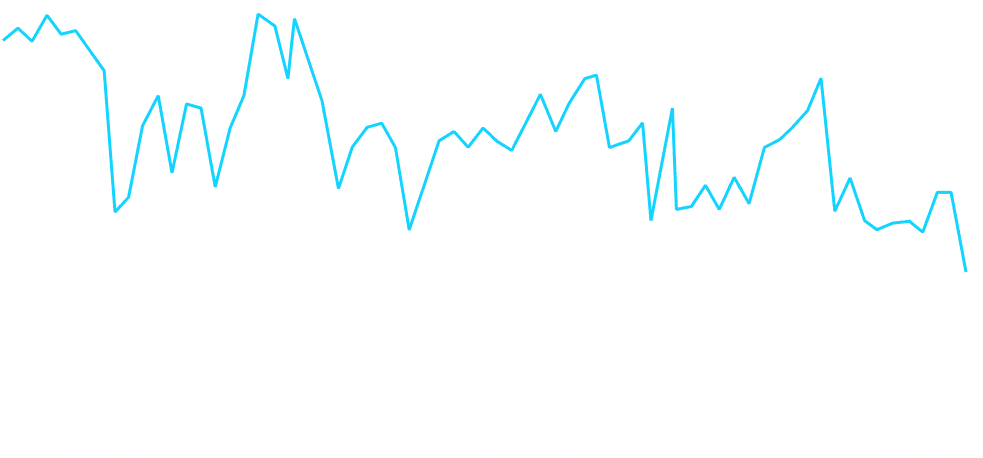
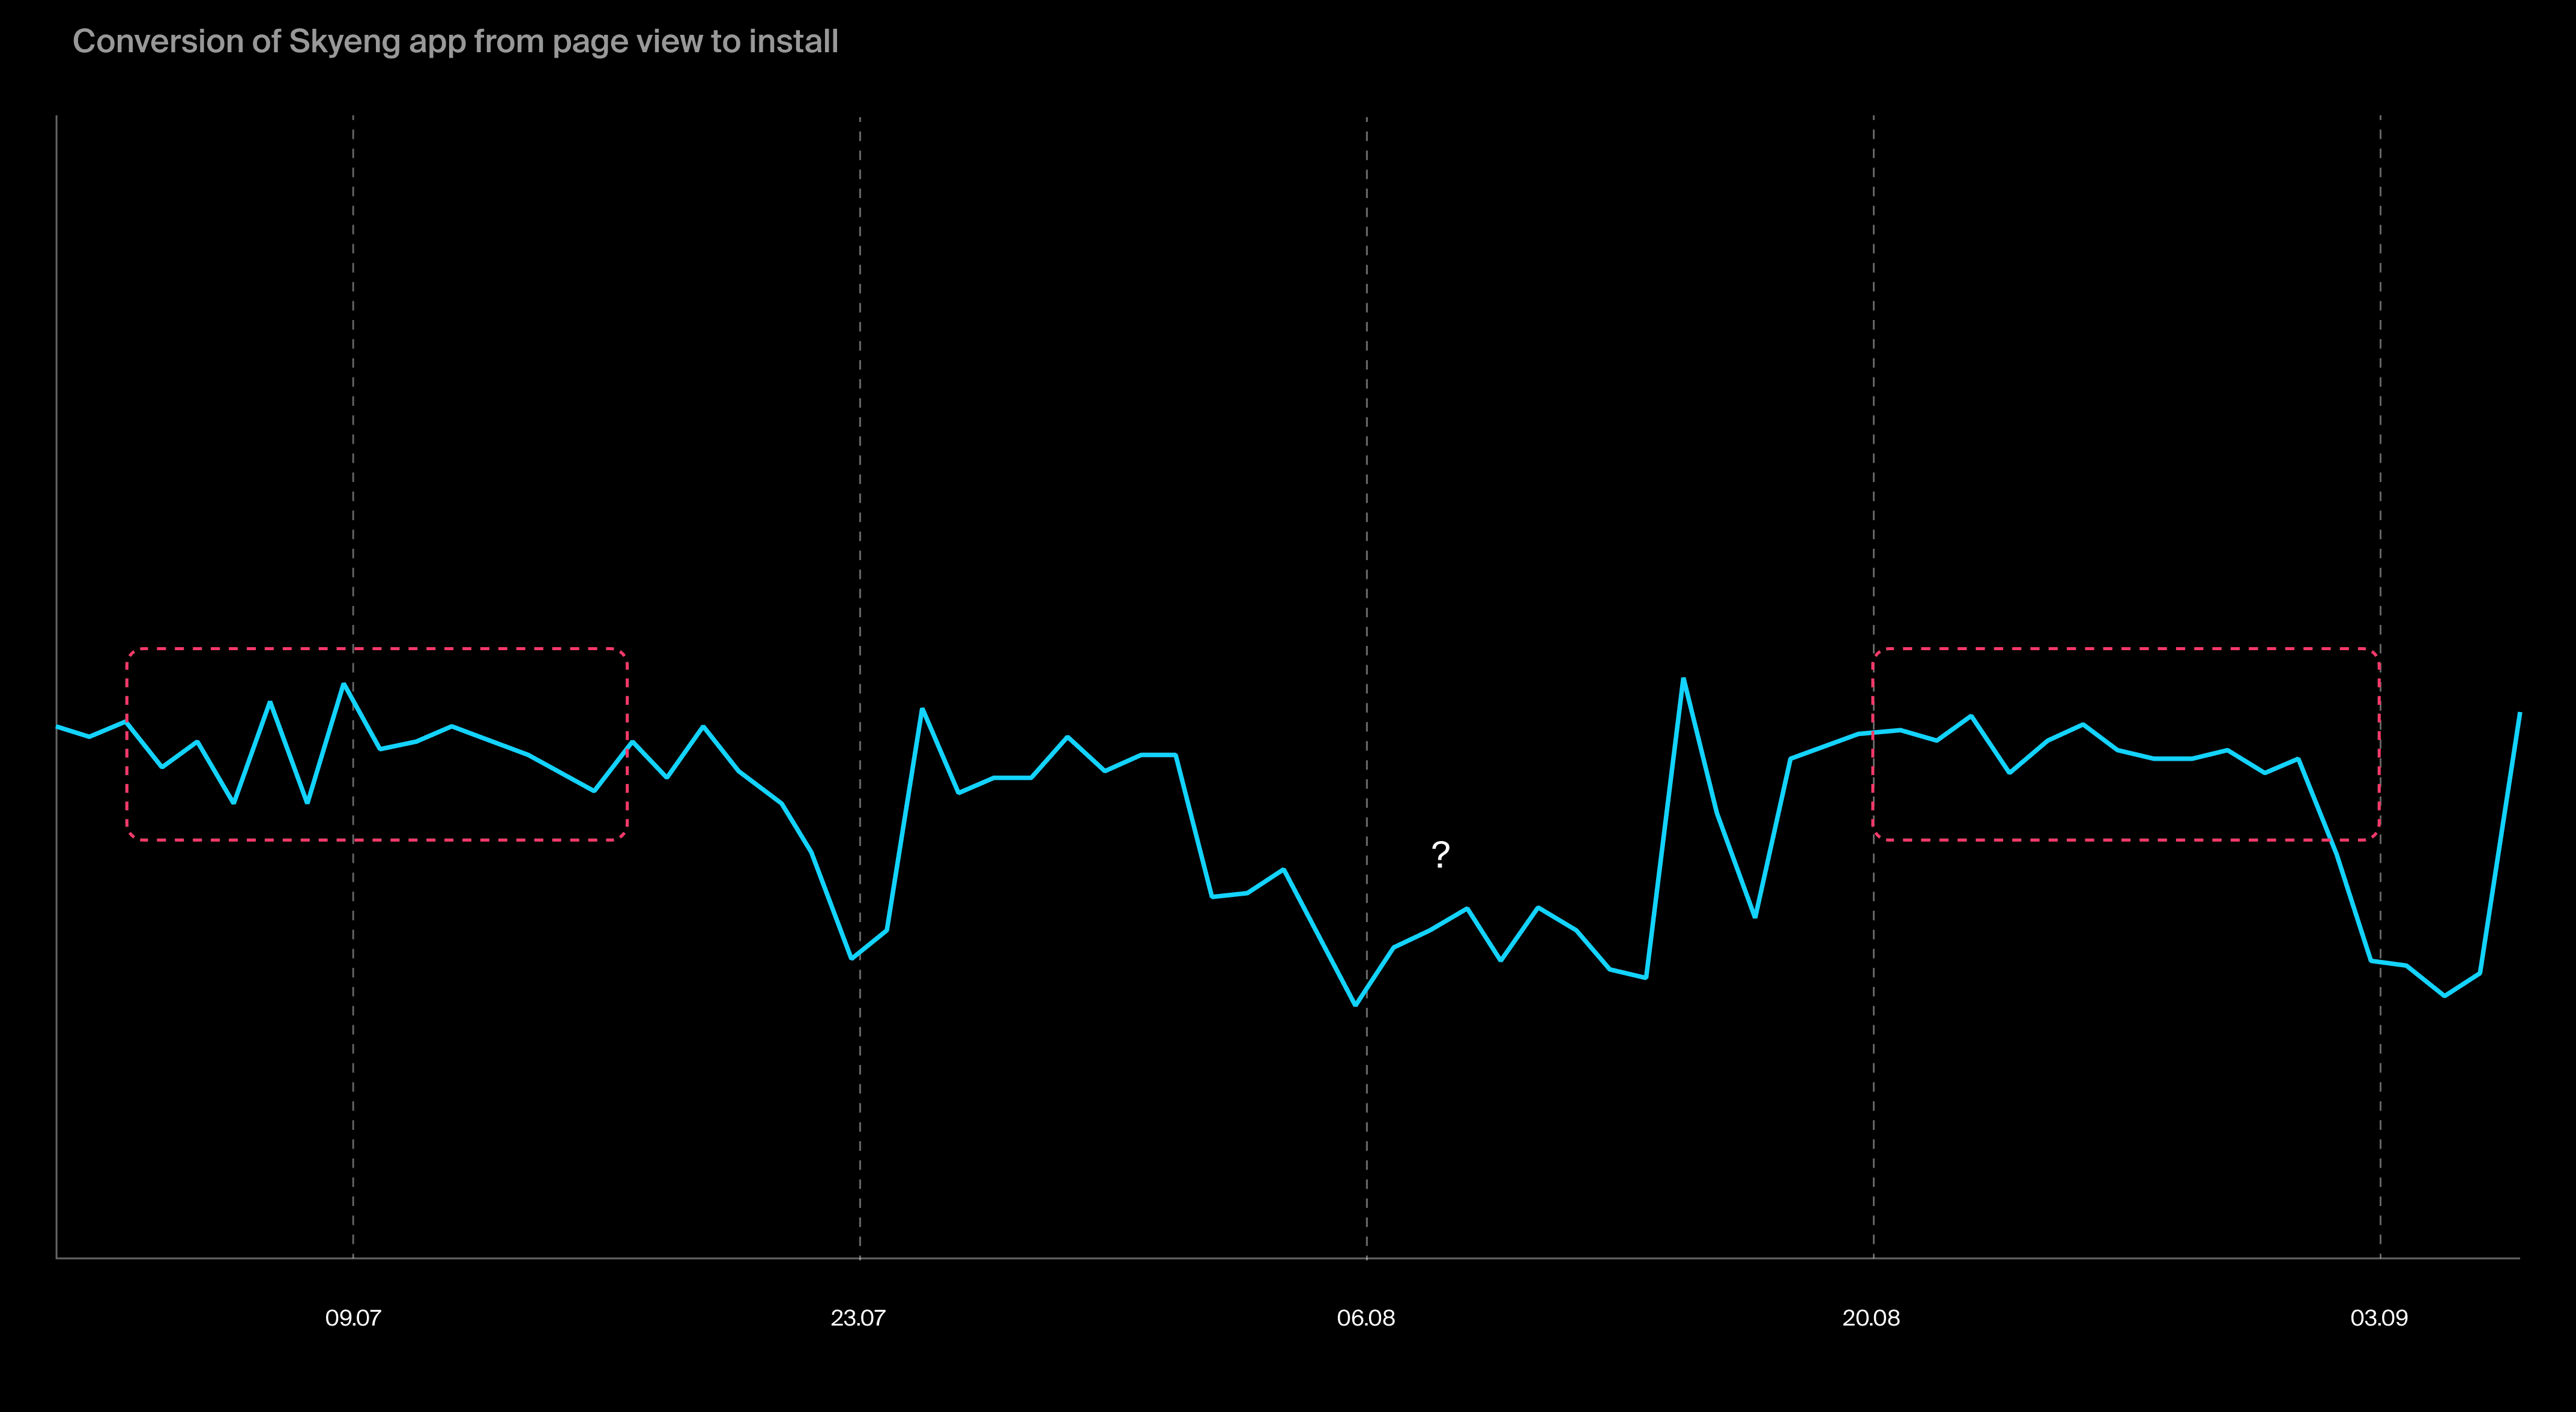
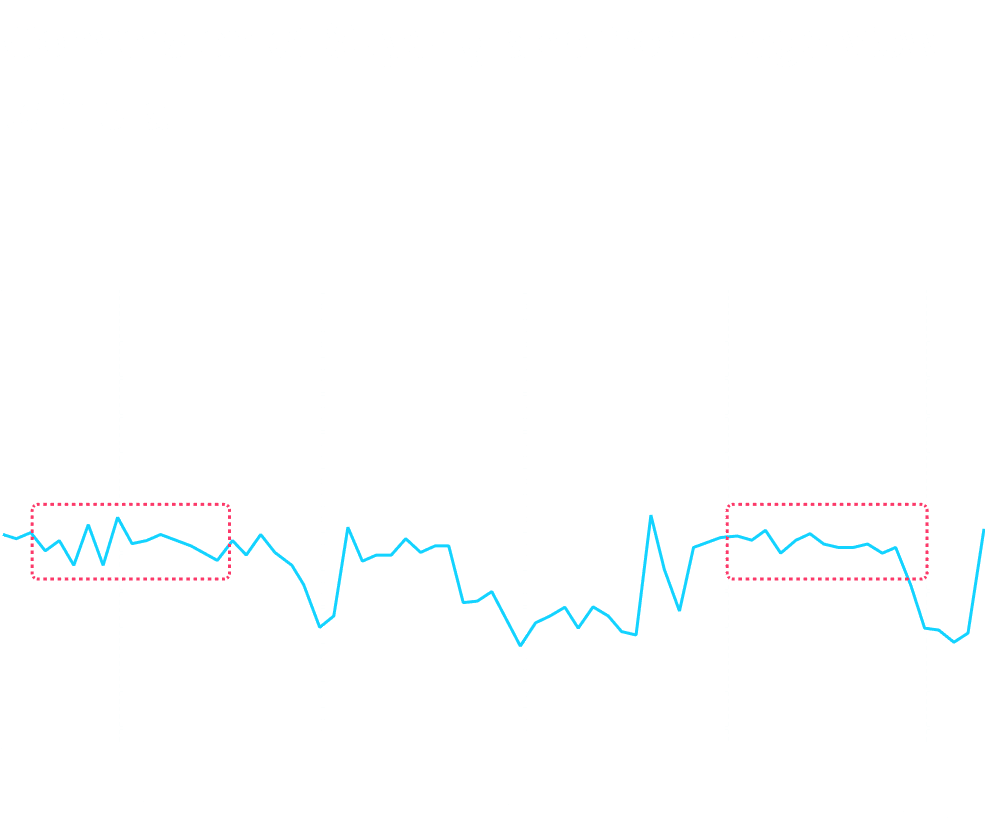
NoteIn this case study we won't look for the reason for the decrease in IR in August. This is a topic for another study.
A drop in conversions in early to mid-August is immediately noticeable, and this is where we really need to better understand what was going on with the experiments in terms of ASO and traffic. It is also important to note that the Install Rate before the drop was similar to the period of lowest Visibility, and it was well above the average benchmarks in this vertical. Based on this information, we can infer that there was something significant happening in August. However, it was not the main reason for Skyeng's falling positions in search.
Next, let's look at the total number of Skyeng app installs compared to its competitors. If there were strong perturbations there, it could lead to weaker search positions
For example, conversions to payment may decrease during the summer, which affects traffic ROI, and User Acquisition volumes have to be reduced. As above, we can't publish the exact data, so we'll use data from public sources.This time, we are using information provided by Sensor Tower. Like Popularity, this data is an estimate, so we cannot be 100% certain of its accuracy. Our experience suggests that such estimates can be significantly different from the actual situation, especially if the app does not receive much traffic.Nevertheless, it would be helpful and interesting to look at even provisional data to assess the situation.
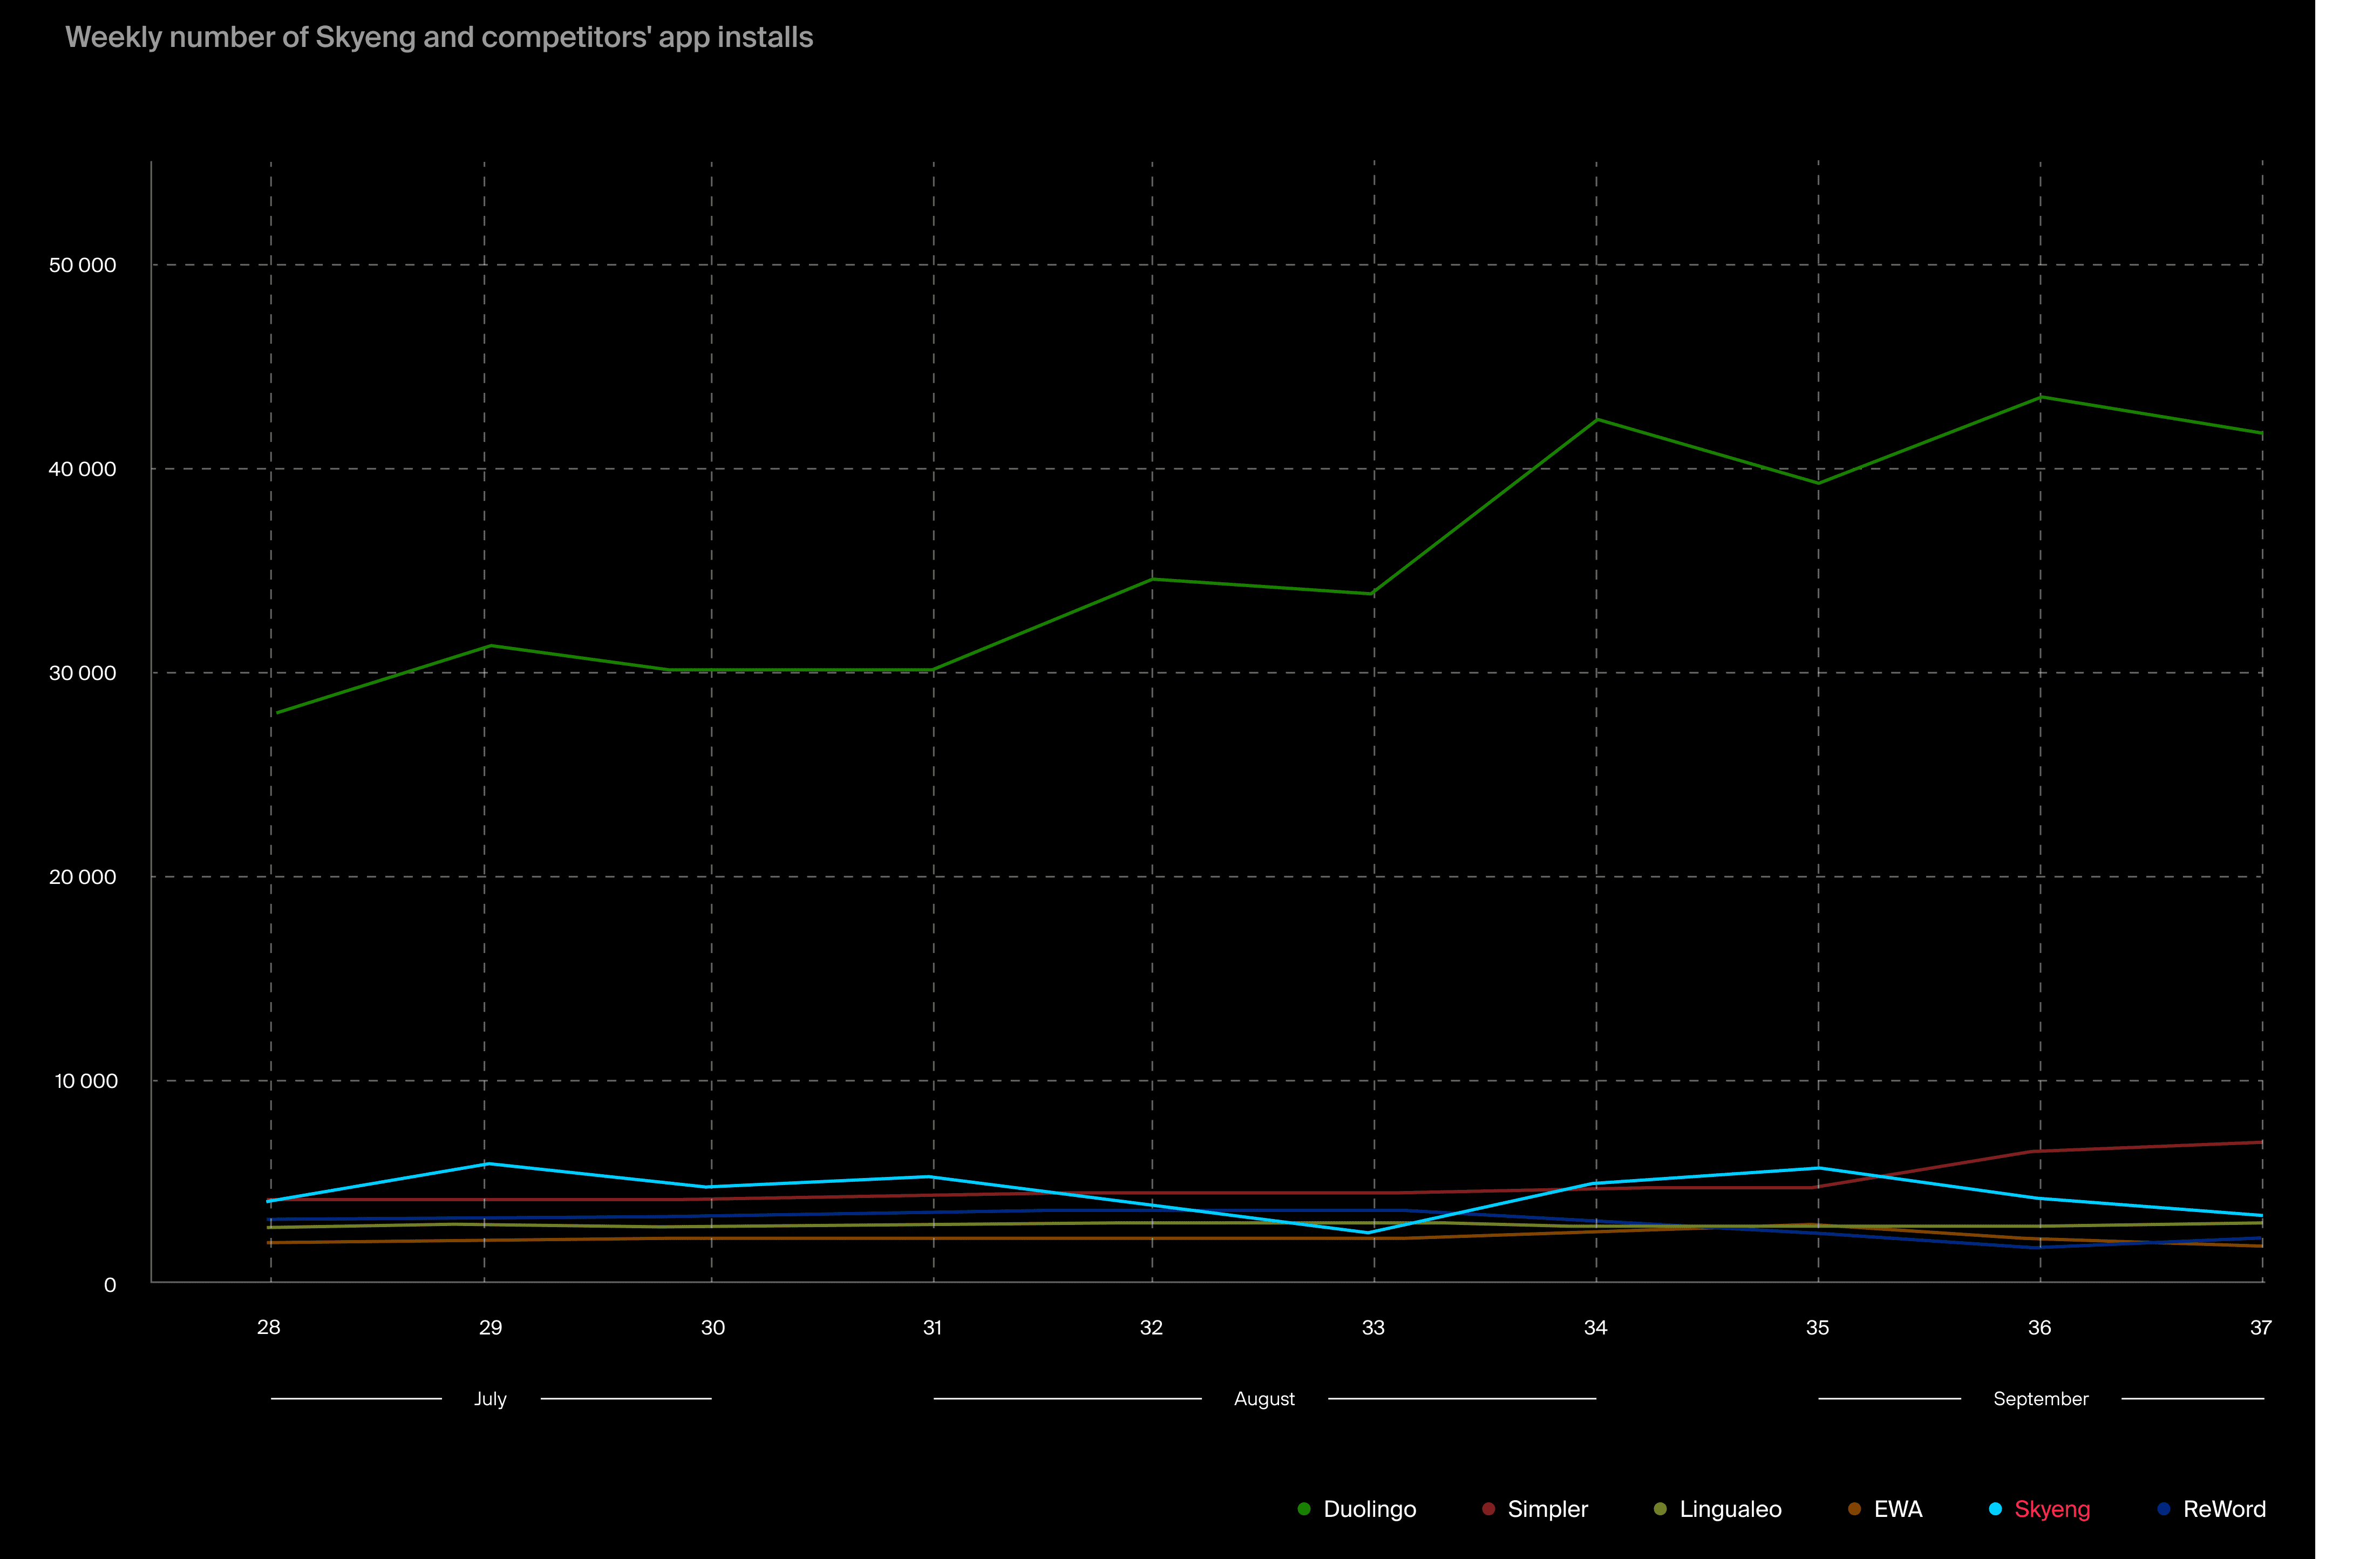
Let's build a chart depicting the weekly number of installs to make it easier to analyze the dynamics:
More about Duolingo installsIf we recall the Visibility chart, we'll see a similar thing here. No doubt, not all installs reflected in this chart are organic. It's likely that Duolingo invests more effort in acquiring traffic from advertising channels. But having such a great number of installs, compared to the competition, is key to holding leadership in search and getting more visibility and, as a result, more organic traffic.
We see an interesting situation here. The total number of installs of Skyeng's Android app is comparable to most competitors, but the clear leader is Duolingo.
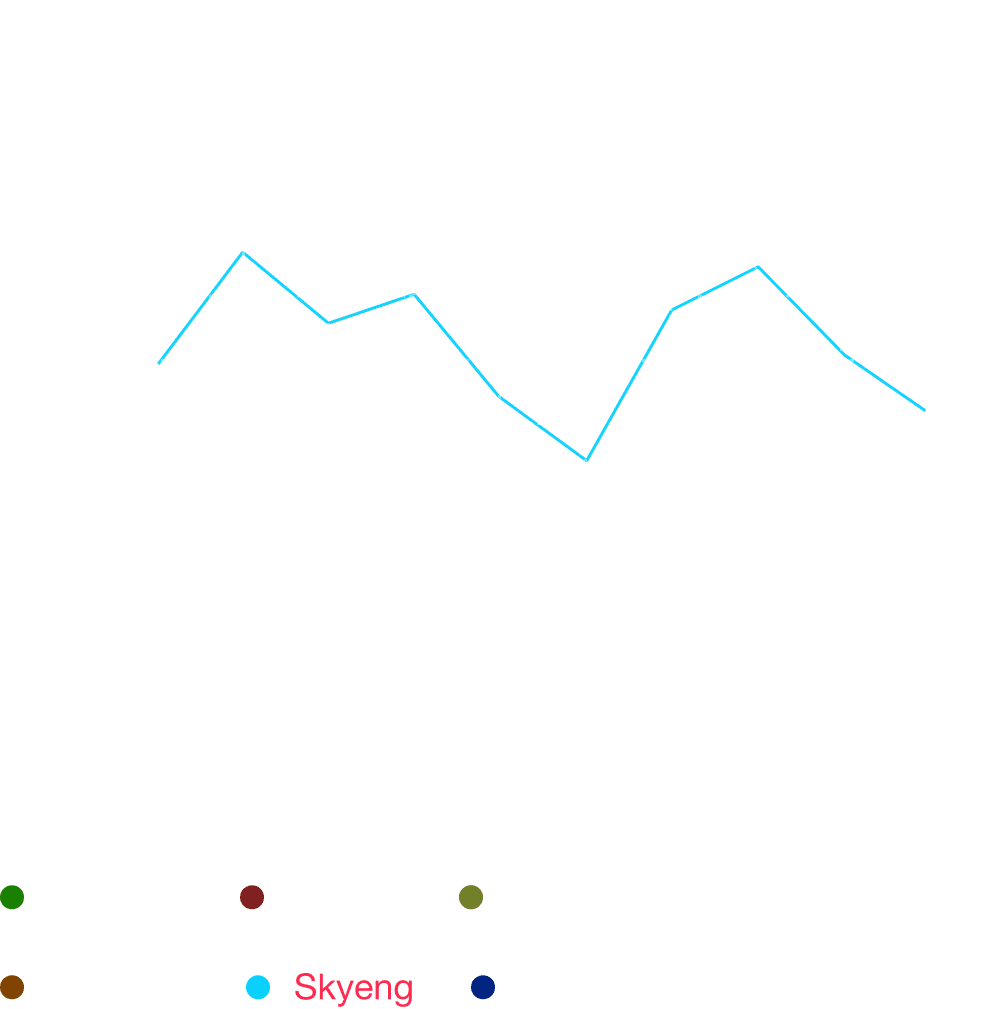
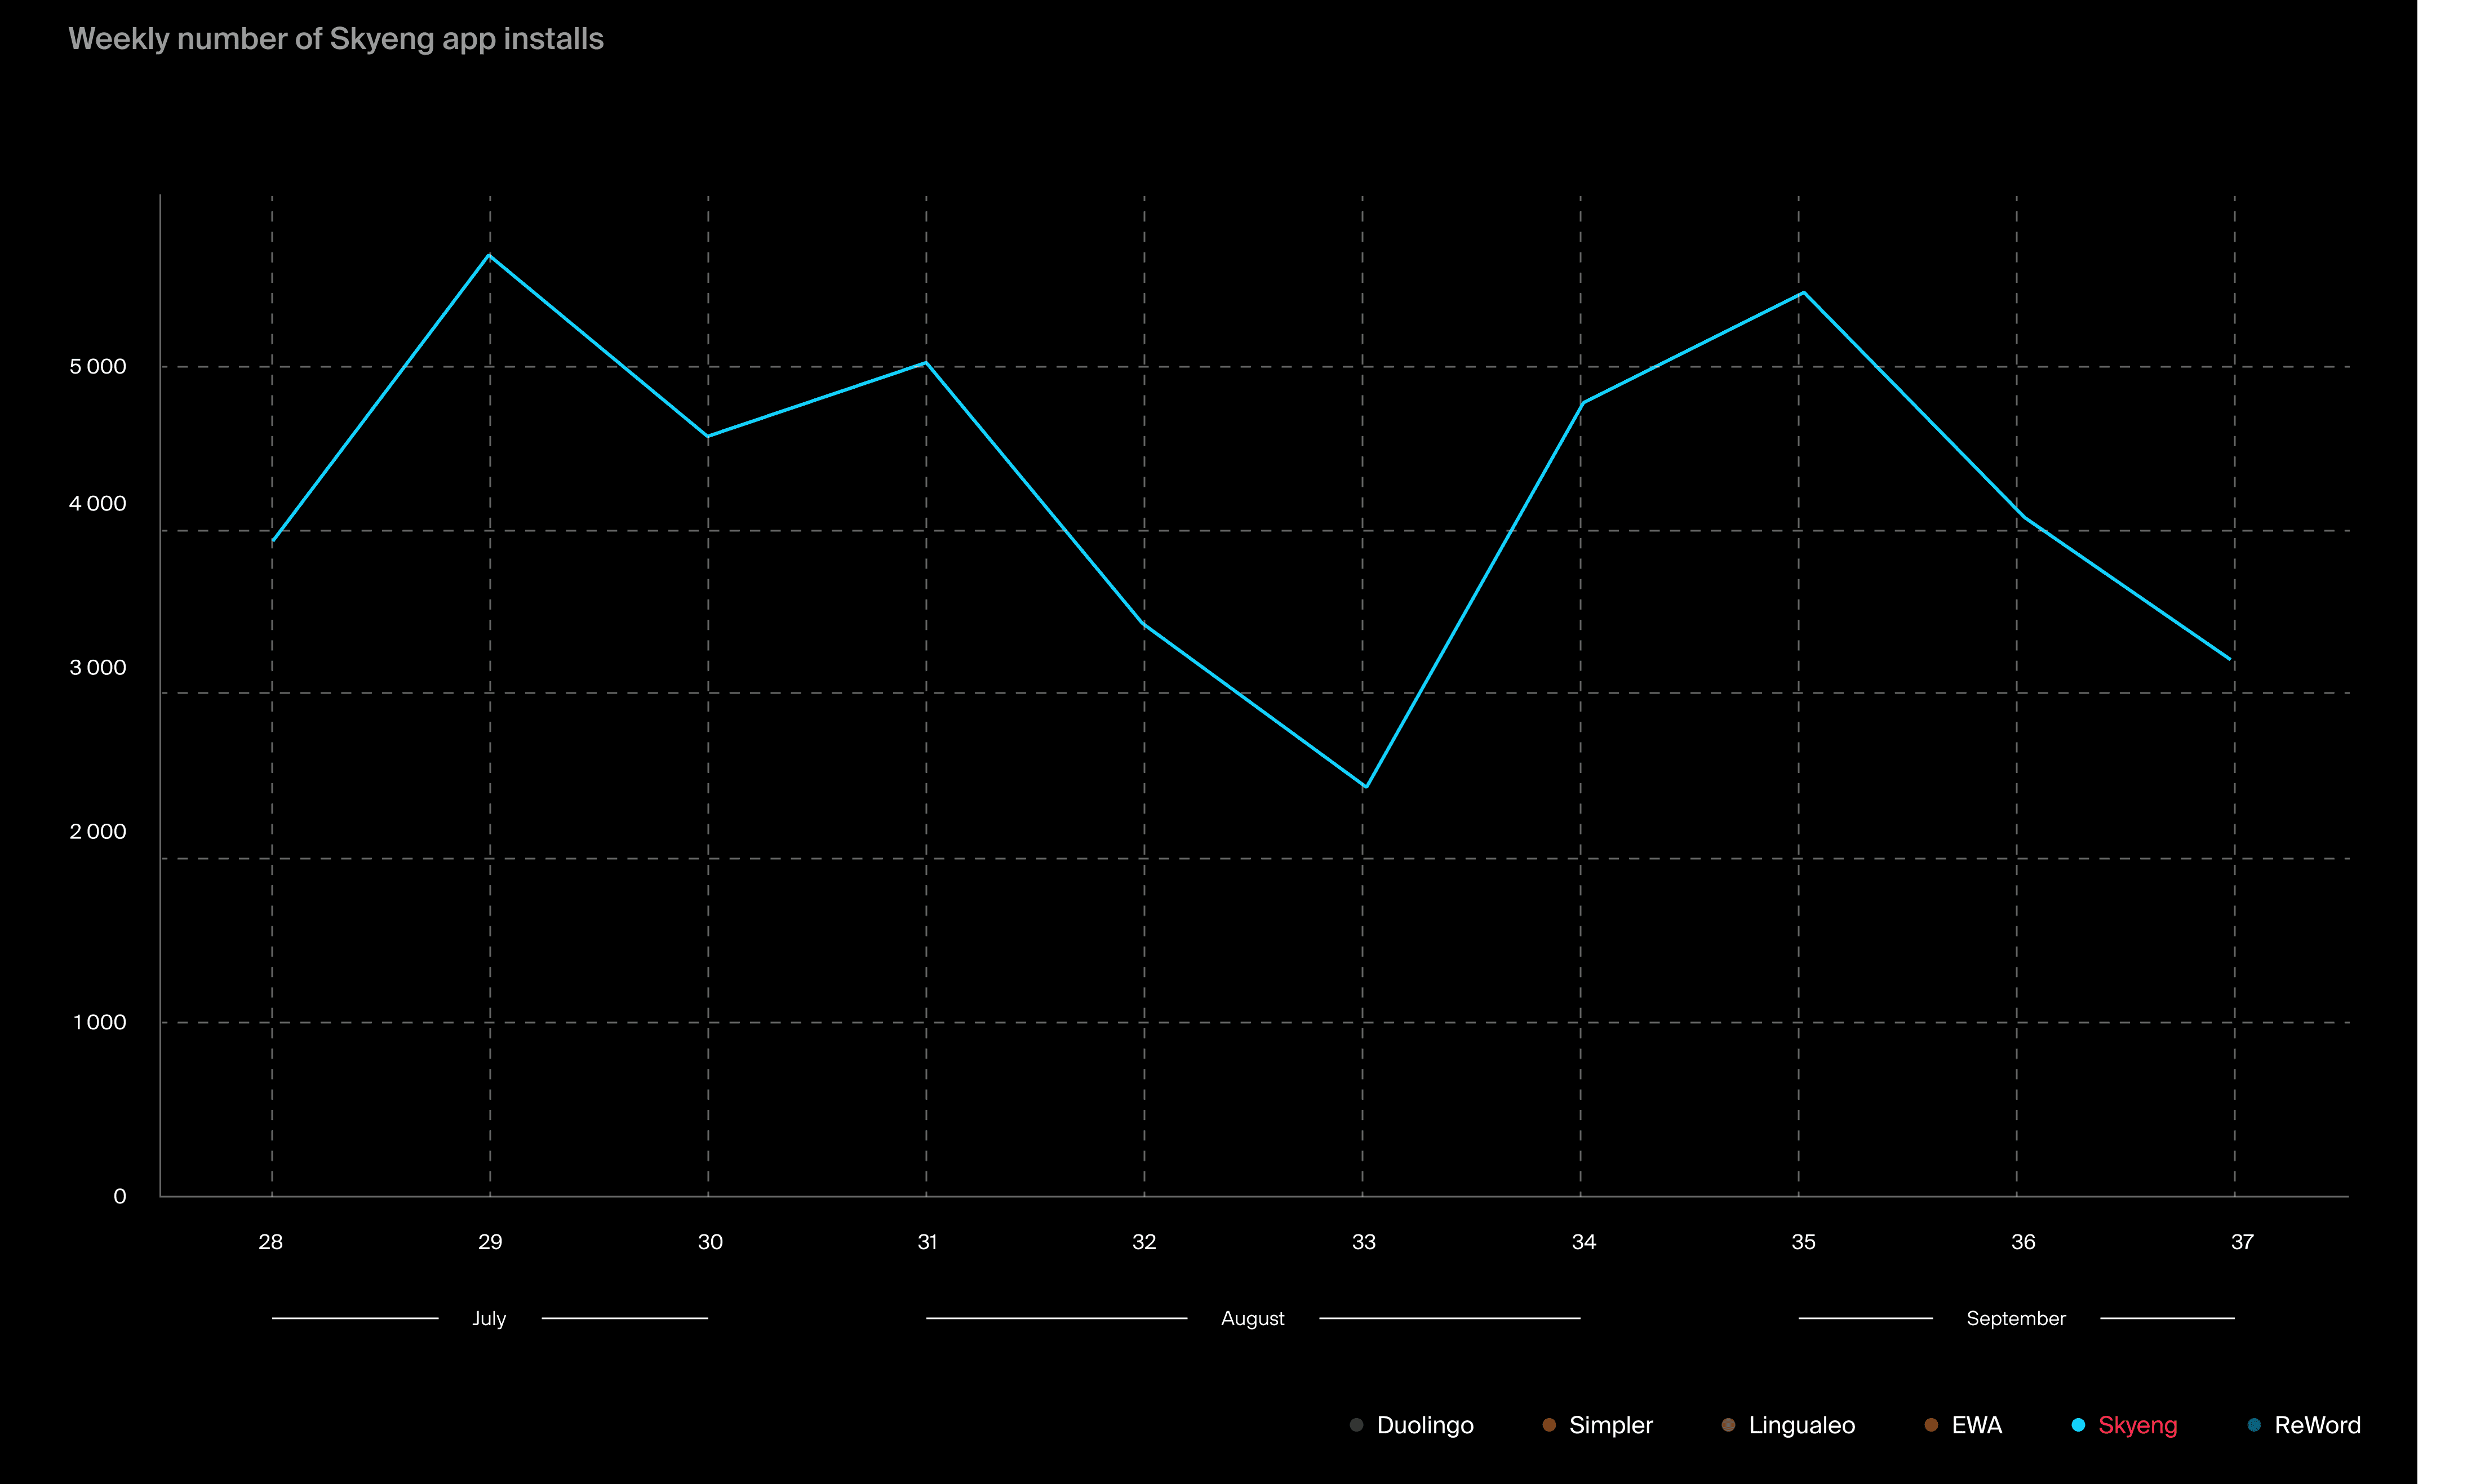
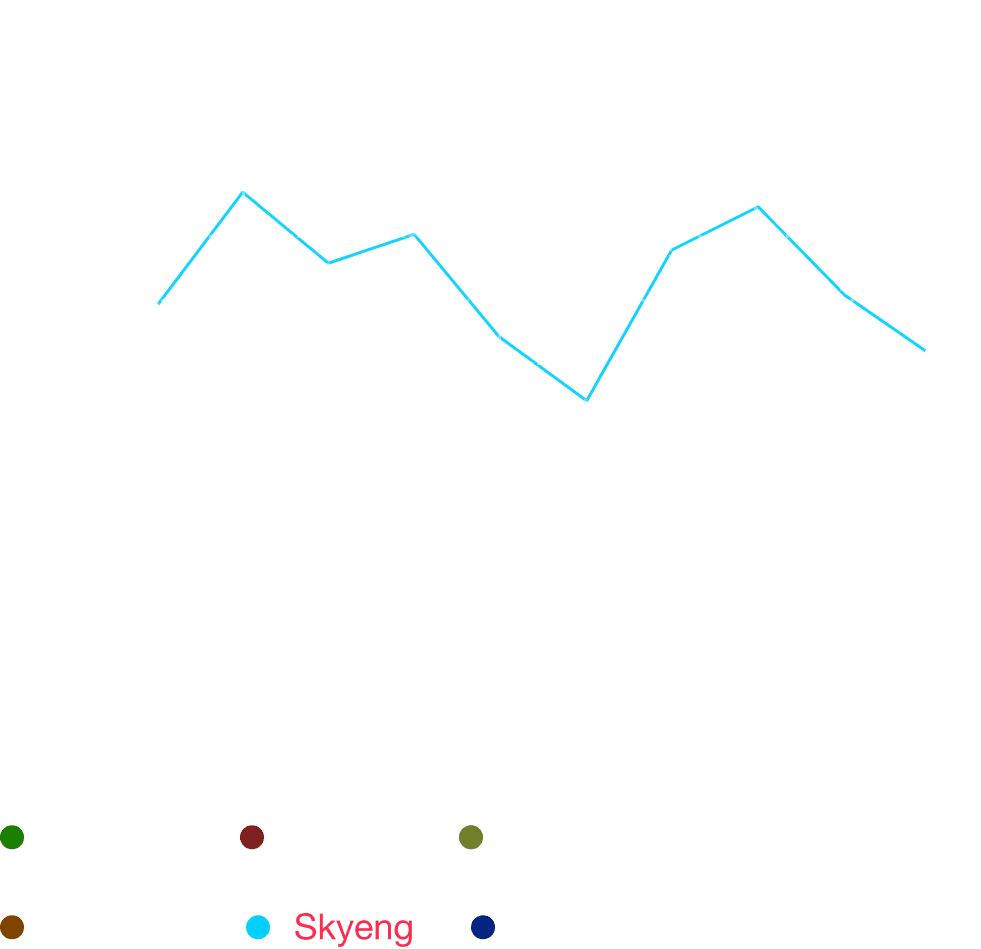
The most important thing on this chart is Skyeng's performance
If we calculate installs as a percentage, they fluctuate from week to week. However, there is no significant difference between the beginning and the end of the period. Therefore, we can conclude that a decrease in the total number of installs may have worsened the situation overall, making it more difficult to maintain our position.To gain a comprehensive understanding of our position compared to our competitors, we should assess the quality of textual metadata optimization and analyze the changes in rankings and scores during the decline period.
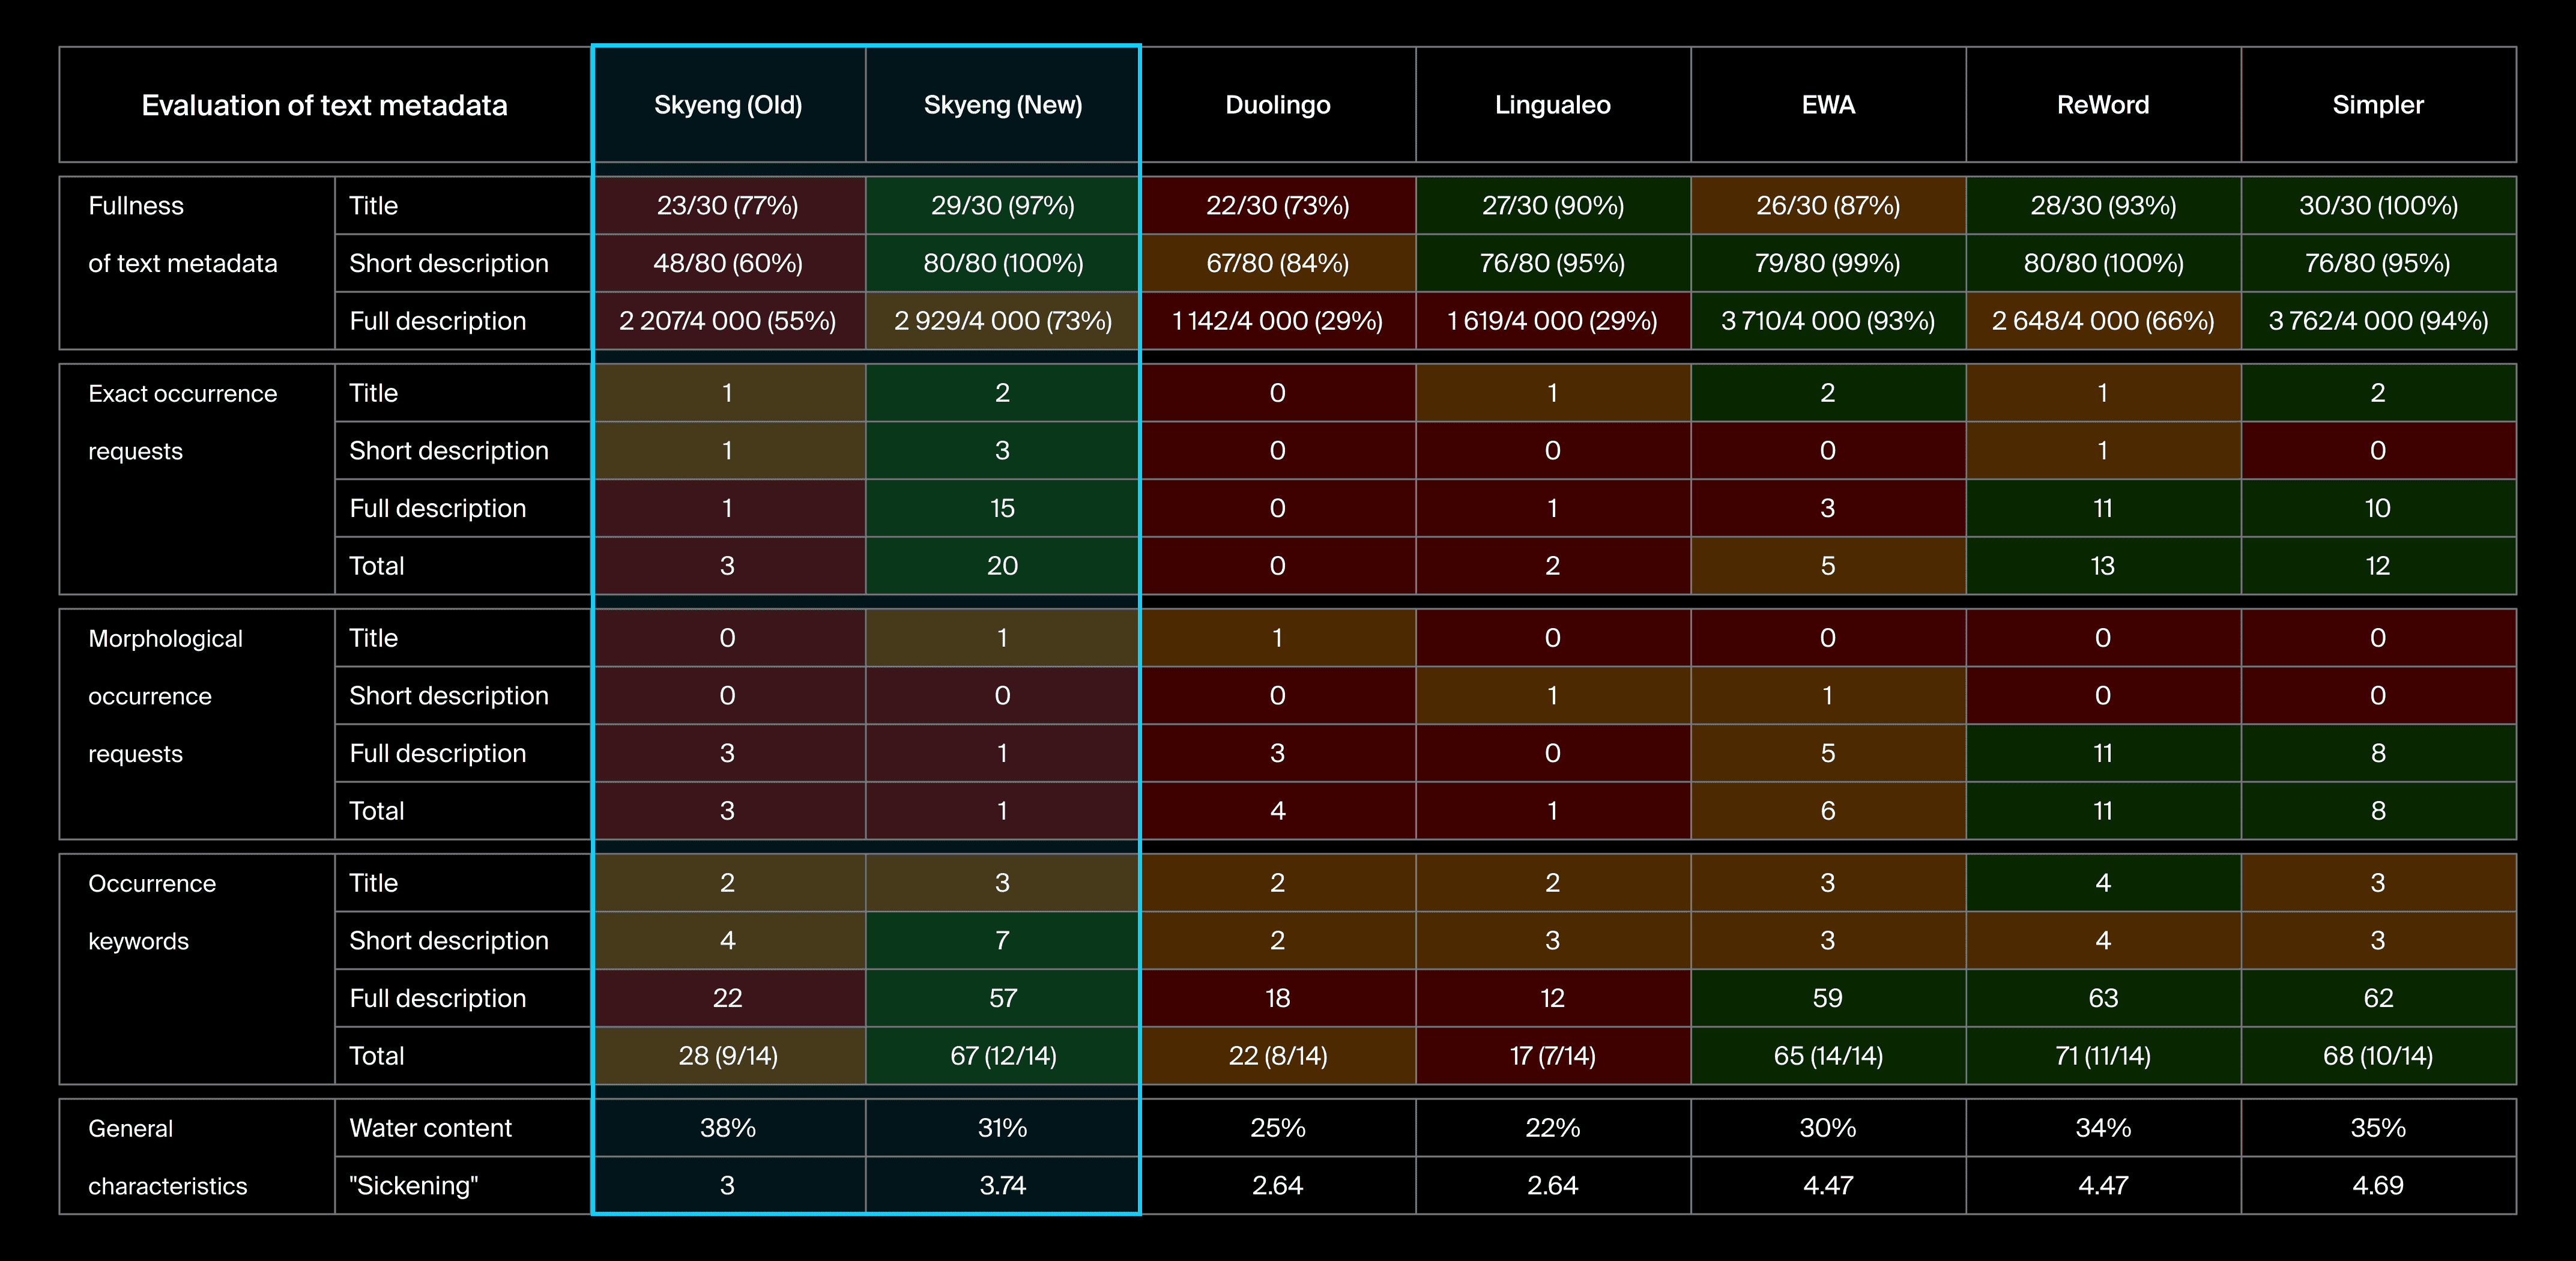
We are going to use the following parameters to assess Textual Metadata in ASO
use of all available characters (%)
morphological match of search requests, including modified word forms (%)
keyword match (%)
we will also pay attention to mentions of search requests and keywords in app reviews
For analysis purposes, we will use the same 25 most popular search requests as keywordsExpectedly, we get a group of keywords that mostly consist of words related to English and learning. We will also take into account the number of occurrences of such words when evaluating textual metadata quality.Next, let's compare the Skyeng app and its competitors using a selected set of criteria
More about competitors' Textual Metadata situationIf we compare Skyeng's optimization with competitors, we can see that most competitors have a much better situation with Textual Metadata in ASO. But there are some interesting subtle points here. For one, Duolingo's optimization is roughly on the same level as Skyeng's, but Duolingo sees way more new installs, which help it hold leadership in search. One thing to note is that Duolingo and Simpler have a lot of reviews containing search requests mentioning learning English. This doesn't directly affect the apps' positions in search results as well, but it does make these projects more relevant to Google Play in the English language learning vertical.
We can conclude that Skyeng's metadata was poorly optimized during the decline period. All available character limits were not used, and there were few occurrences of search requests and keywords. It's worth noting that metadata itself affects indexing in search, while metadata optimization quality affects the elasticity of positions.If metadata is poorly optimized, other factors—such as a decrease in total installs or Install Rate—may contribute more to the loss of positions. This makes sense, as Google Play's search algorithms will consider the app less relevant than its competitors.
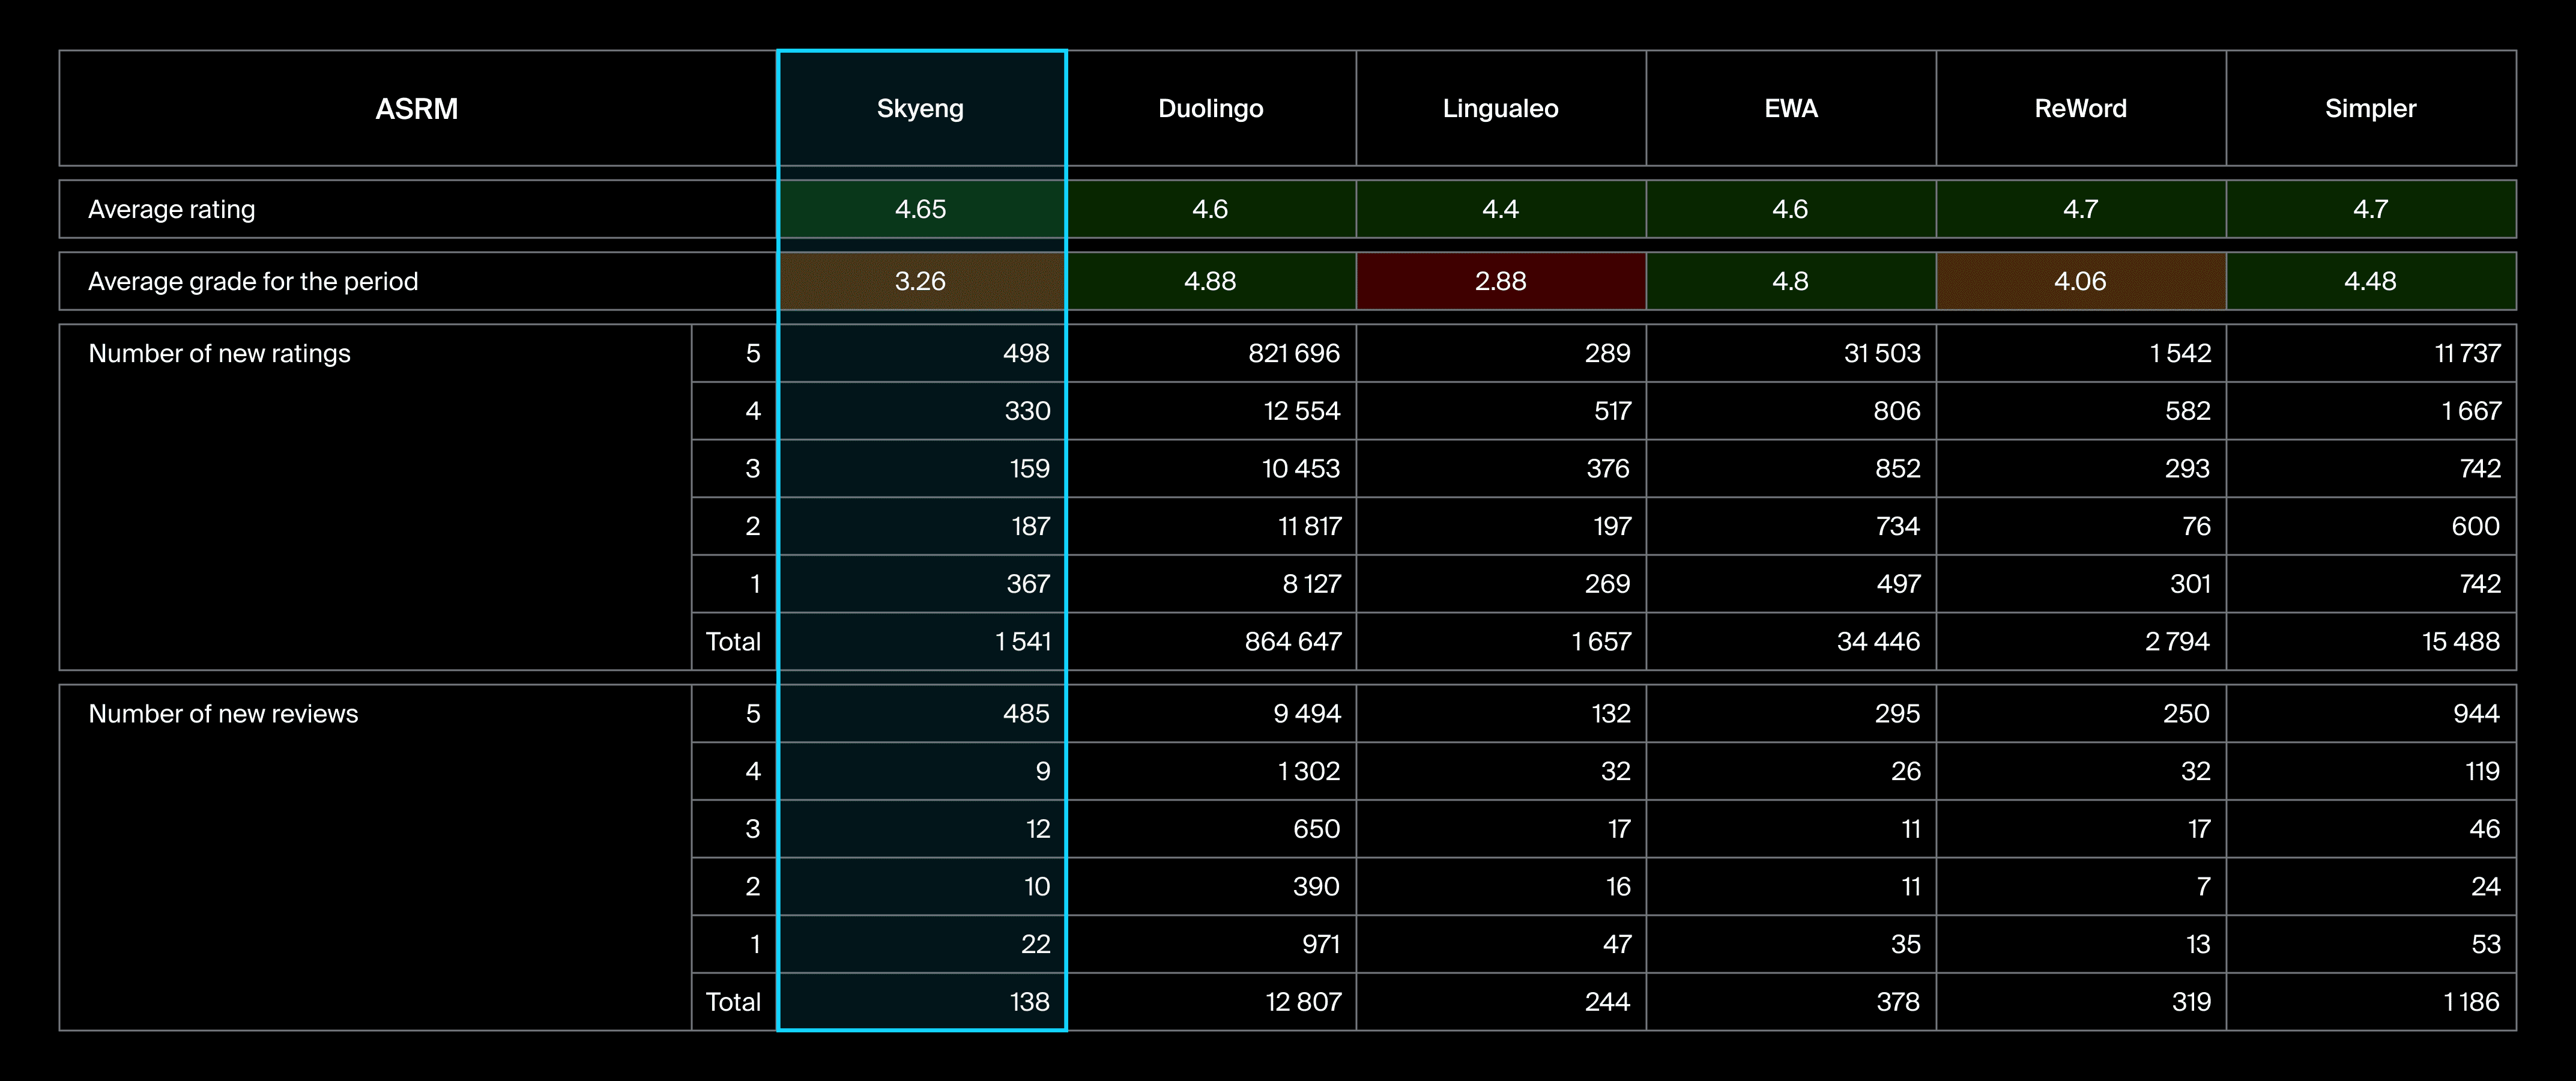
Before deciding on next steps, we need to check what happened to Skyeng's rankings and reviews during the decline period
More about Duolingo ratingIt is worth paying attention to the leader, Duolingo. This project has times more ratings than any other rivaling app — just because Duolingo has much more traffic, not just in Russia, but also in many more countries. That said, Google Play shows the app's rating and number of ratings in total for all countries. And this is why the situation is understandable.
Skyeng is doing nice here. And while the average score in the period is below 4, it has a negligible impact on the total rating, which remains above 4.6.Now we have a complete picture for the period from July to September, when there was a negative trend in Skyeng's position and visibility in search. Based on this data, we need to make a list of hypotheses that can remedy the situation, and determine the first steps.
Let's get it started then
To figure out the possible scenarios, let's recall our results of analyzing the situation and comparing data with the competitors
The number of installs fluctuates significantly from week to week. This may affect the positions. In the category we see a powerful rival that drives way more traffic.The Install Rate is above the average, which speaks for Skyeng's good graphic ASO and mighty brand.Skyeng has poorer text optimization quality than its competitors. Such a disadvantage could weaken the position in the long run.The rating situation is stable: the app does not have an abnormal influx of negative reviews or ratings. The average rating in the period, 3.26, could have affected the positions but that impact would be insignificant.
From these findings, we can form the following hypotheses that may affect position growth
1Increase the number of installs from search using incentive traffic
2Upscale UA to attract more installs
3Adjust the flow of positive reviews to level the average rating for the period
4Update textual metadata
Textual Metadata Optimization Rules
Title (30 characters). It should include the most relevant and popular words with the exact match. We need to keep the word forms unchanged here—to get indexed for important words.
Short description (80 characters). It's also very important for indexing and should contain relevant and popular keywords: they can be duplicated here or in the full description. Keyword duplication can improve indexing. Use the brief description to tell users about the key value of the app, its purpose and functions. The brief description must not only contain keyword occurrences: it should be visually appealing.
Full description (4,000 characters). Try to duplicate the keywords in the full description to augment indexing.
In the full description, use keywords with exact, diluted, and morphological match (depending on the hypothesis). There is no single correct solution. Everything has to be tested based on the results achieved.
We adhere to the rule of keyword occurrence to avoid overspamming (occurrence density should be within 2-5% per 3,500-4,000 characters).
Then we repeat the keyword 3 to 5 times in the text, putting it in different places (across 3,500 characters in the description). If text volume is 2,500 characters, reduce the number of occurrences to 2-3 times.
We check text in GNL (Google Cloud Natural) to make sure it is relevant to the category and get a high Confidence score: it's important so that our app will show up among similar apps in recommendations. This way we will drive traffic to our app, while our positions in search will grow progressively.
An unspoken rule says that the first and last 200 characters are indexed best. Therefore, we include the most popular keywords in the first and last 200 characters. But this hypothesis should be tested: it doesn't always work. This rule is not officially in the guideline, but it is an opinion among experts in the ASO community.
All these hypotheses must result in positions growing. But there is a good reason why we highlighted the hypothesis on updating metadata. In fact, good ASO is the foundation for the gradual growth of organic traffic. Without it, all other activities will be much less effective, and the results will not be long-lasting. Even if we immediately start using incentive traffic and get the positions back to the top, the app page must be well optimized to consolidate the position, otherwise the positions will start to roll back.So, the first thing we decided to do is update textual metadata. It's especially important because it doesn't take much timeSpeaking of Textual Metadata in ASO, our task is improving metadata in terms of the metrics that we used to compare Skyeng with the competitors. In text optimization, we are guided by the following rules
The resulting metrics for the new textual metadata are as follows
Why weren't morphological occurrences added?
We deliberately did not add morphological occurrences because:
In this version of metadata, we wanted to analyze dynamics after increasing the number of exact-match occurrences.
Morphological-match occurrences have potentially less weight than direct occurrences.
We significantly increased keyword occurrences to dilute the description and avoid making it over-optimized.
The number of direct occurrences of search requests and keywords at all meta levels increased significantly
Now we need to update metadata. And here are some tricks to utilize. Significant updates to the text part of the page may lead to changes in indexing
An unobvious way to use A/B tests on Google PlayConceptually, it's intended for comparing performance of different page elements and publishing items demonstrating the best IR/indexing results. This tool allows you to customize the distribution of versions between user groups with different numbers of users. For example, you can create an experiment and show new elements only to 50% of users, or you can make it so that only 10% of the audience sees them. That's the idea behind using such a tool for smooth metadata updates. We create an experiment with new page texts and publish the new version to a group of 10% of users. During the experiment we monitor the number of requests in the index and the view-to-install conversion. If nothing critical happens, we publish a new version for all users.
And while for a young app indexing surges may not be critical, and changes can be quickly rolled back, it can be a more serious problem for large companies.To replace the text part of the page smoothly, we decided to roll it out step by step. The Google Play console has a special tool for ASO A/B tests.
Steps of textual metadata implementation using A/B tests
16.09.2022Launched an A/B test for the full description. After 5 days, the test was stopped. Then we introduced a new full description
22.09.2022Launched an A/B test for the short description. After 5 days, the test was stopped. Then we introduced a new short description.
27.09.2022Updated the title. It was the last element we changed. Due to a restriction in the system, we can't launch an A/B test for the title in the console.
As a result, textual metadata update went smoothly. The next stage was checking if our first hypothesis panned out.
Two weeks later
Ranking on Google Play works in a different way than on the App Store. It doesn't respond immediately, so it takes time to evaluate the effect of change. We decided to wait for a couple of weeks. Such a period is usually enough to notice a response from the store.Our main task was to stop the decline of positions and at least return them to their previous values. This would have a positive impact on the number of organic installs received by Skyeng.This means that we will evaluate efficiency by the following parameters:
App positions for the 25 most popular search requests.
App visibility compared to the competitors.
Number of organic installs.
Looking ahead, we must say that our hypothesis turned out well and optimization of textual metadata resulted in renewed growth of positions.
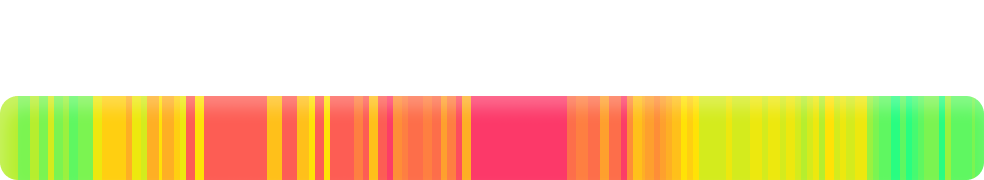
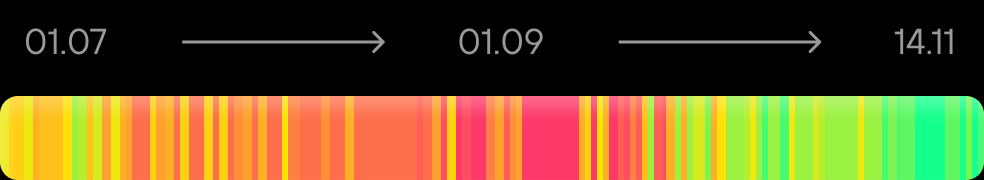
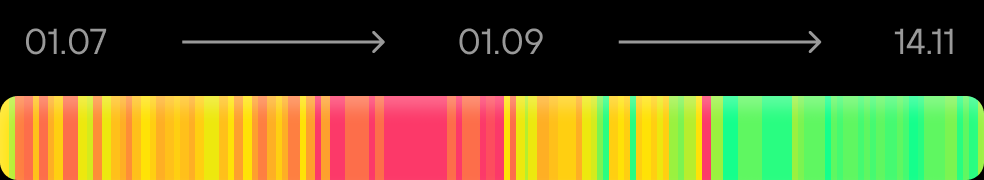
A week after the first meta update, a gradual increase in positions began, and it consolidated its hold after all metadata was uploaded
Учить английский
78
Выучить английский язык
67
Изучение английского
65
Английский язык обучение
65
Английский язык
60
Изучать английский язык
59
Выучить английский
59
Изучение английского языка
56
Выучить английский язык с нуля
56
Английский для начинающих
53
Учим английский язык с нуля
51
Учим английский
48
Обучение английскому языку
47
Репетитор по английскому
47
Уроки английского языка
45
Изучай английский
40
Выучи английский
38
Учим английский язык
37
Изучать английский
36
Изучать языки
36
Аудио английский изучение с нуля
33
Учить английский бесплатно
31
Учить слова английского языка
30
Выучи английский язык
29
Учить английский язык с нуля
26
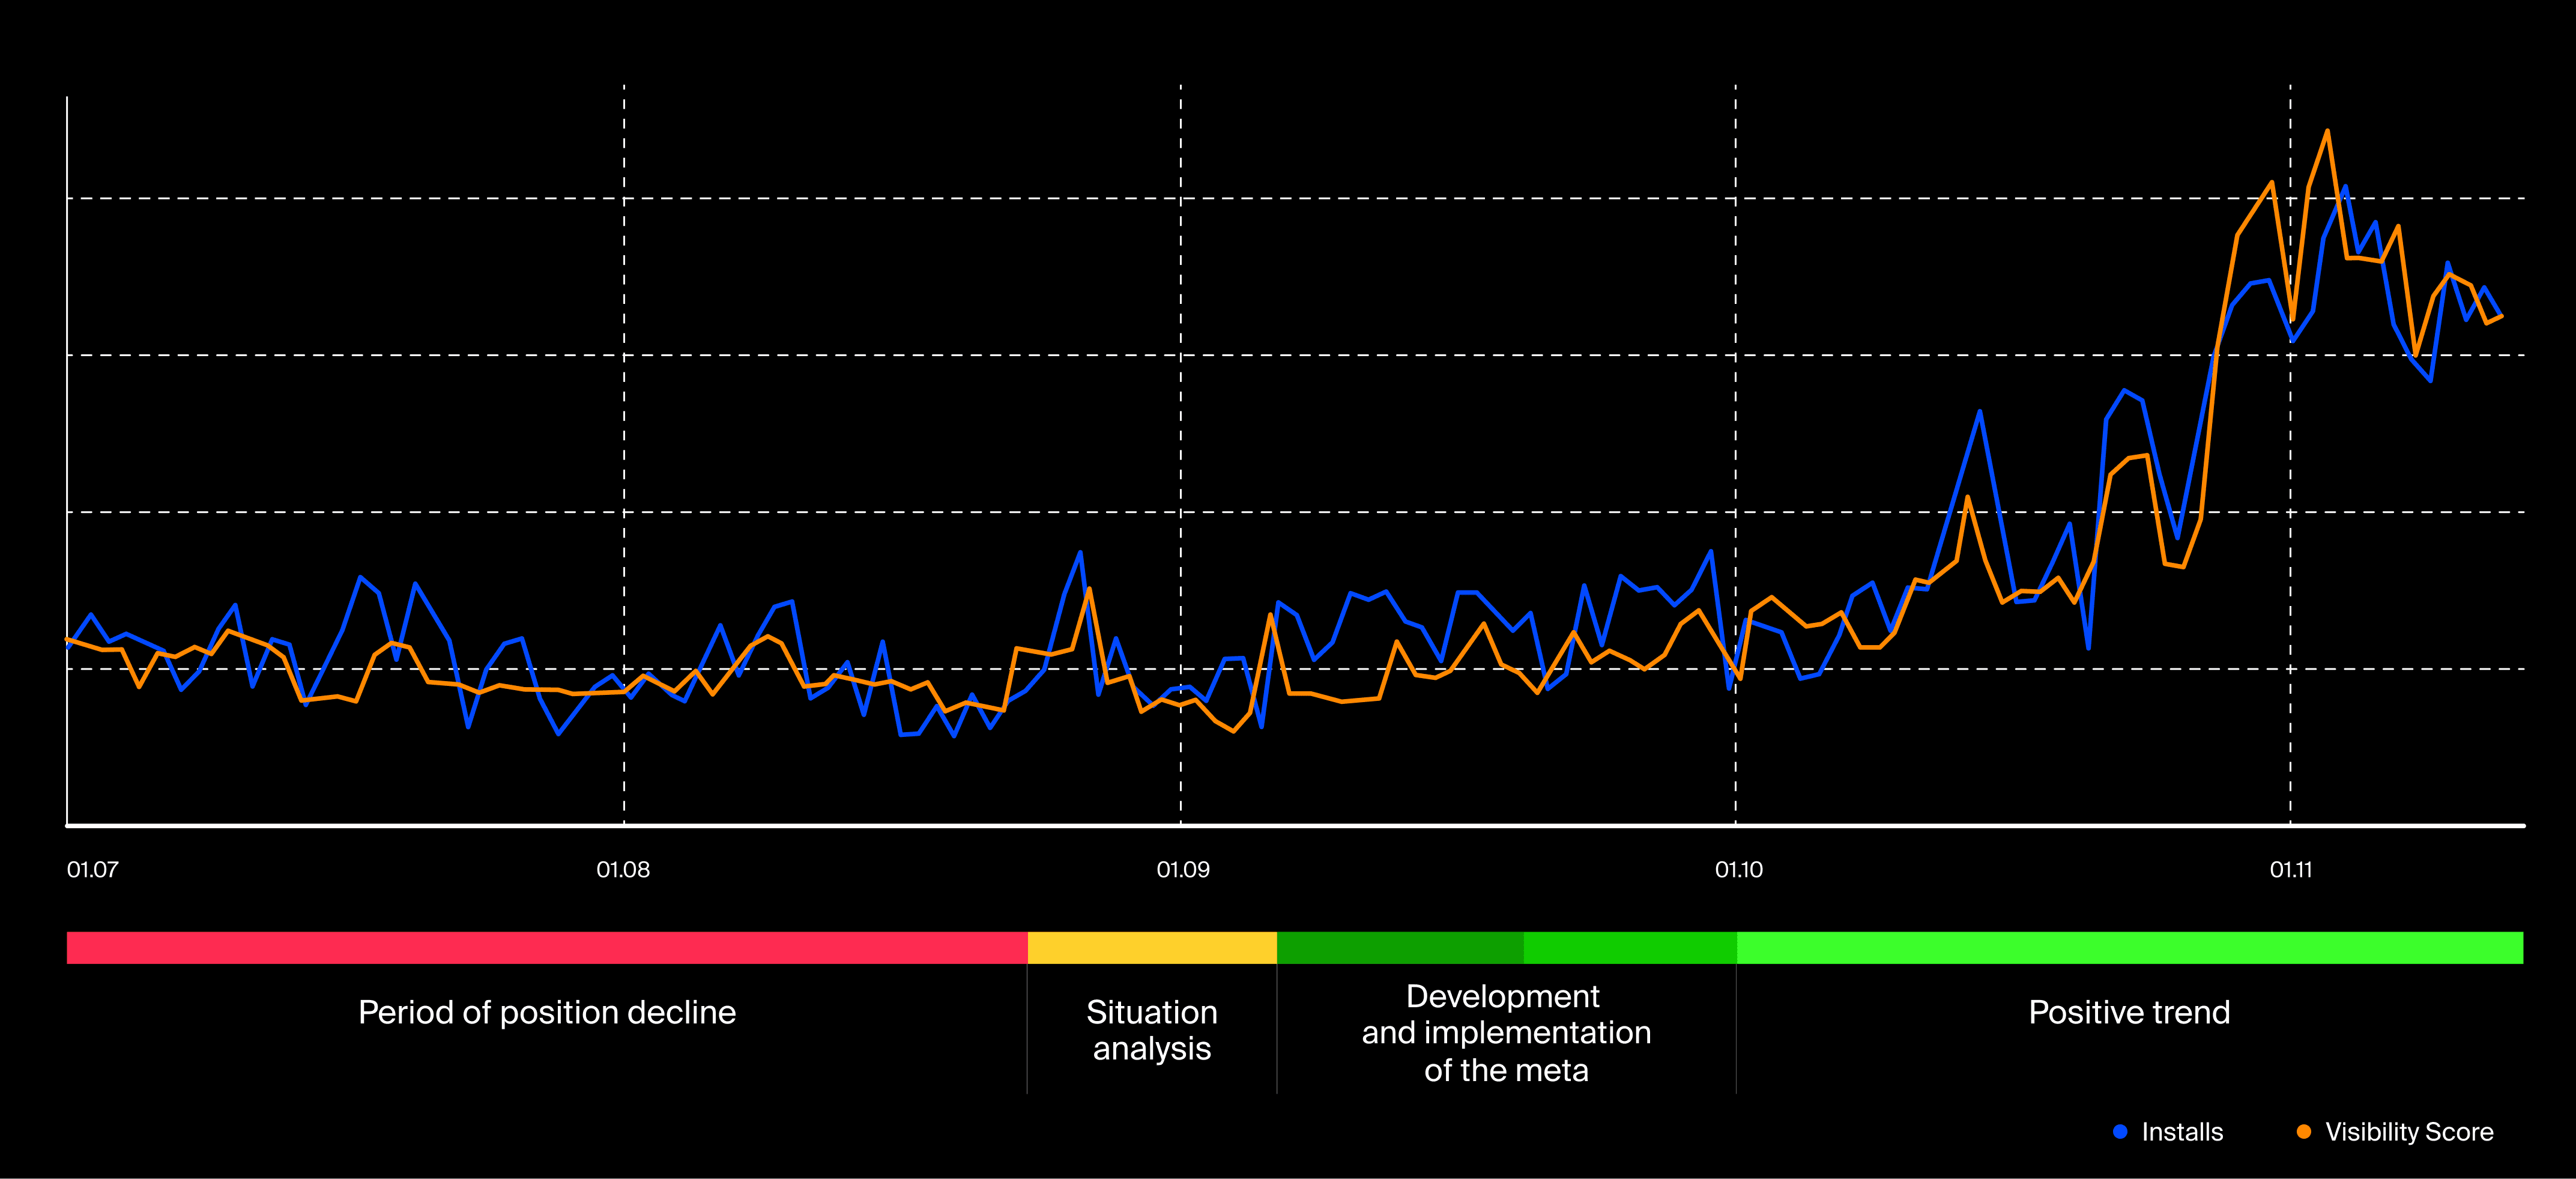
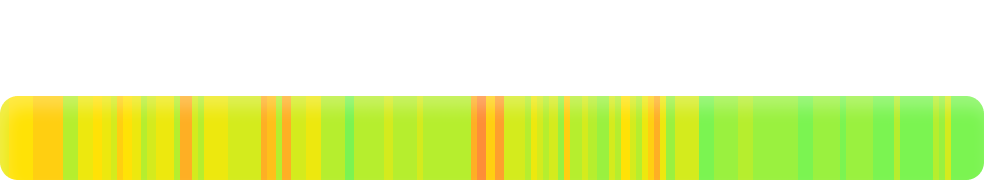
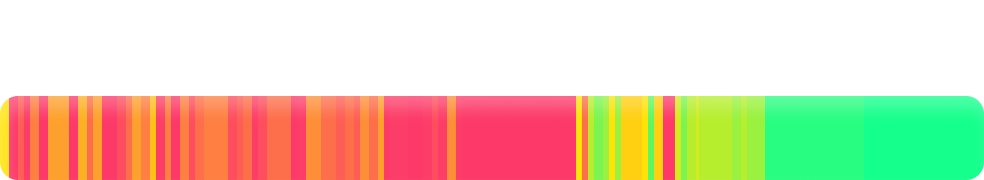
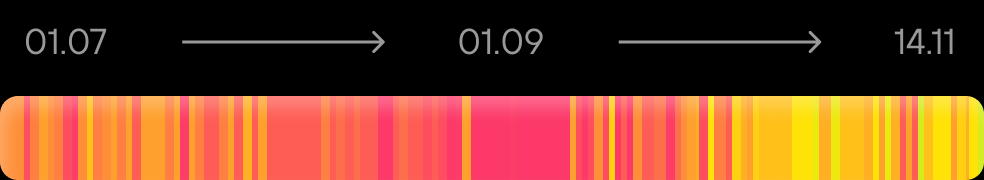
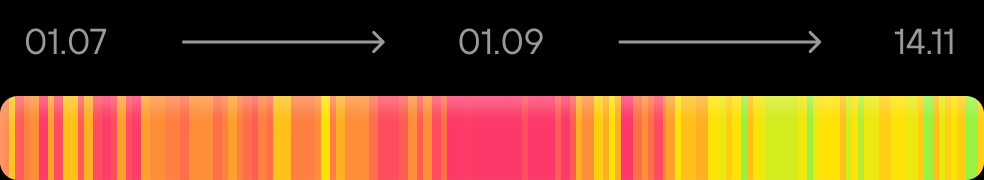
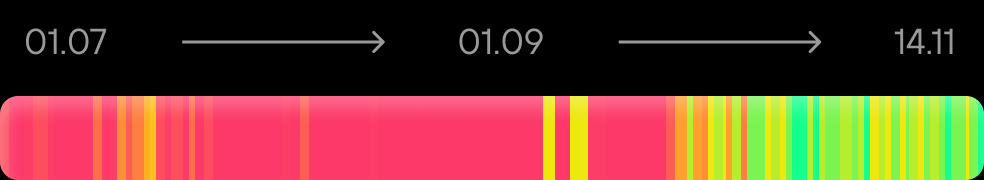
Not just did the positions return their July values but they continued to grow. By mid-November, Skyeng was among the top 10 results on Google Play for all popular search requests.How the increase in positions has affected the visibility score compared to competitorsSteady growth is also seen here, with the visibility of some competitors starting to decline. It makes sense because these rivals yielded high positions to Skyeng for some search requests. And though there are more rivals in search results than we used for our analysis, the change in visibility share is clearly visible in this data as well.How the visibility share had changed by November 14Relative to selected competitors, visibility has changed by 15 percentage points, placing Skyeng in 3rd place in terms of this indicator. It's certainly not number one, but Duolingo holds a very strong position and competing with this app for visibility is yet to come.How much of an impact Skyeng's increased visibility had on organic installsWe must remind that we can't demonstrate any exact values. So let's just take a look at the installs chart.Along with the increase in visibility, there is also a clear trend toward more organic installations. We compared the number of installs for the same periods before and after metadata optimization and saw an increase of 31%.This is a good result. However, as previously mentioned, there is still a significant amount of work to be done. The vertical we are operating in has a broad semantic range and a high demand from organic sources. This indicates that there is ample opportunity to attract organic installations and anticipate even better results.
Summary
In this case study we tried to describe in detail our approach and the tools we use to assess the market and the specific situation in terms of Organic Growth.
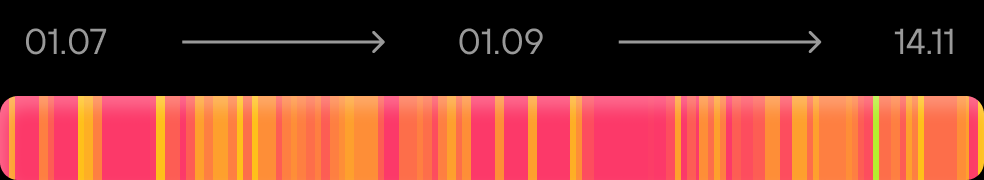
Before we draw any conclusions, let's take a look at the timeline
In conclusion, we publish a comment from the Skyeng teamI would like to express my gratitude to the Appbooster team for their professional work. They provided us with a full range of ASO services: from strategy development to implementation, and were ready to help always, at any time of the day. Thanks to their ASO expertise we were able to increase our organic installs. I am very pleased with the result and recommend Appbooster to anyone looking for a reliable partner to promote their apps.
ElvinaSenior UA Manager Skyeng
Here are the takeaways
Before taking any specific steps, take a look at everything from different angles. Without focusing on the product, pay attention to the competition and the market as a whole.
Build a coordinate system and pick proxy metrics that will help you assess the dynamics, both negative and positive. It would be great if it could help you see how you perform compared to your competitors. This system will also help rank hypotheses before taking action.
If you use calculated metrics, check if they correlate with real data. In our case we made sure the visibility index correlates well with the increase in installs. This relationship sees reasonable, but you want to check even the most logically flawless things. Remember that you deal with data, and data is always accompanied by allowances and errors.
Let's get back to proxy metrics and Visibility Score. It's very important for us as a service and service provider to have these tools in our arsenal. We don't always have access to the analytics systems or developer consoles of our partners. But we still need to respond to any change as fast as we can. This means it's imperative that we have a kit of appropriate tools.
Methodology is also a must for ranking hypotheses. We usually use variations of ICE. We start with those hypotheses that can deliver a greater effect at the lowest cost. Such an approach allows you to follow a clear plan instead of bouncing ideas around. And a coordinate system will help you quickly assess the real Impact.
Though ASO is a quite transparent tool, it's no less important. We recommend that you always include the optimization experiments in your marketing roadmap. Let's say it again: Good ASO is key to growing organic traffic and User Acquisition. Textual Metadata optimization improves the app's indexing and shows search algorithms how closely the app matches the semantics, which helps it get a better foothold in high positions. Meanwhile, Visual Metadata optimization augments the Install Rate, helping attract more organic and paid users while maintaining the budget. And it also has a positive impact on ranking algorithms, app positions, and visibility in app stores.
Though this case study was dedicated to ASO, our cooperation with Skyeng continued. We are much obliged to the project team for their consent to publishing this material. We will share more results of our cooperation.Appbooster welcomes feedback. If you have any questions or comments on the case study, you can always email us at[email protected] or contact us directly on Telegram: @eugeneplotnikov
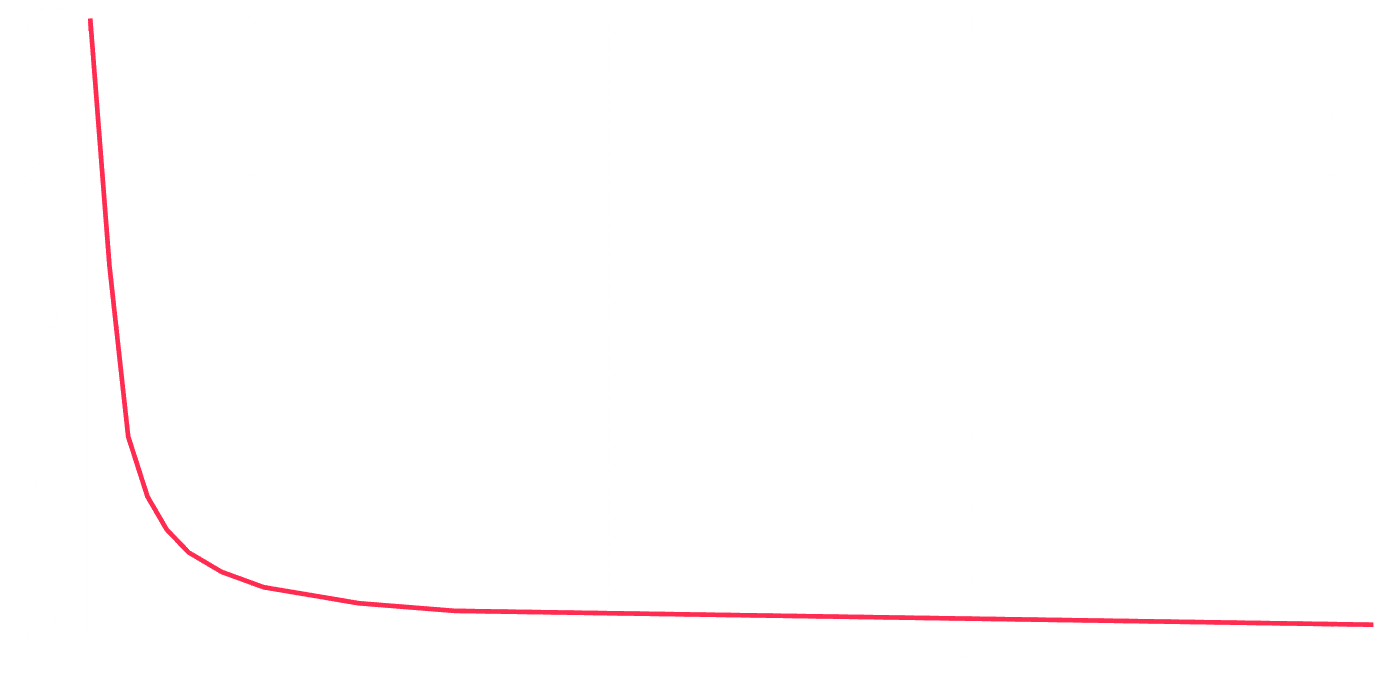
 Practice shows that data modeled by this function (see the chart) correlates well with the values of real cases. For example, we can see that the app loses a significant amount of traffic after dropping from the first position to the second. But the loss is not so great after the app moves from the eighth to the ninth, while the traffic difference between the 29th and the 30th positions will be insignificant. It makes sense, as very few users dive that deep into search results.
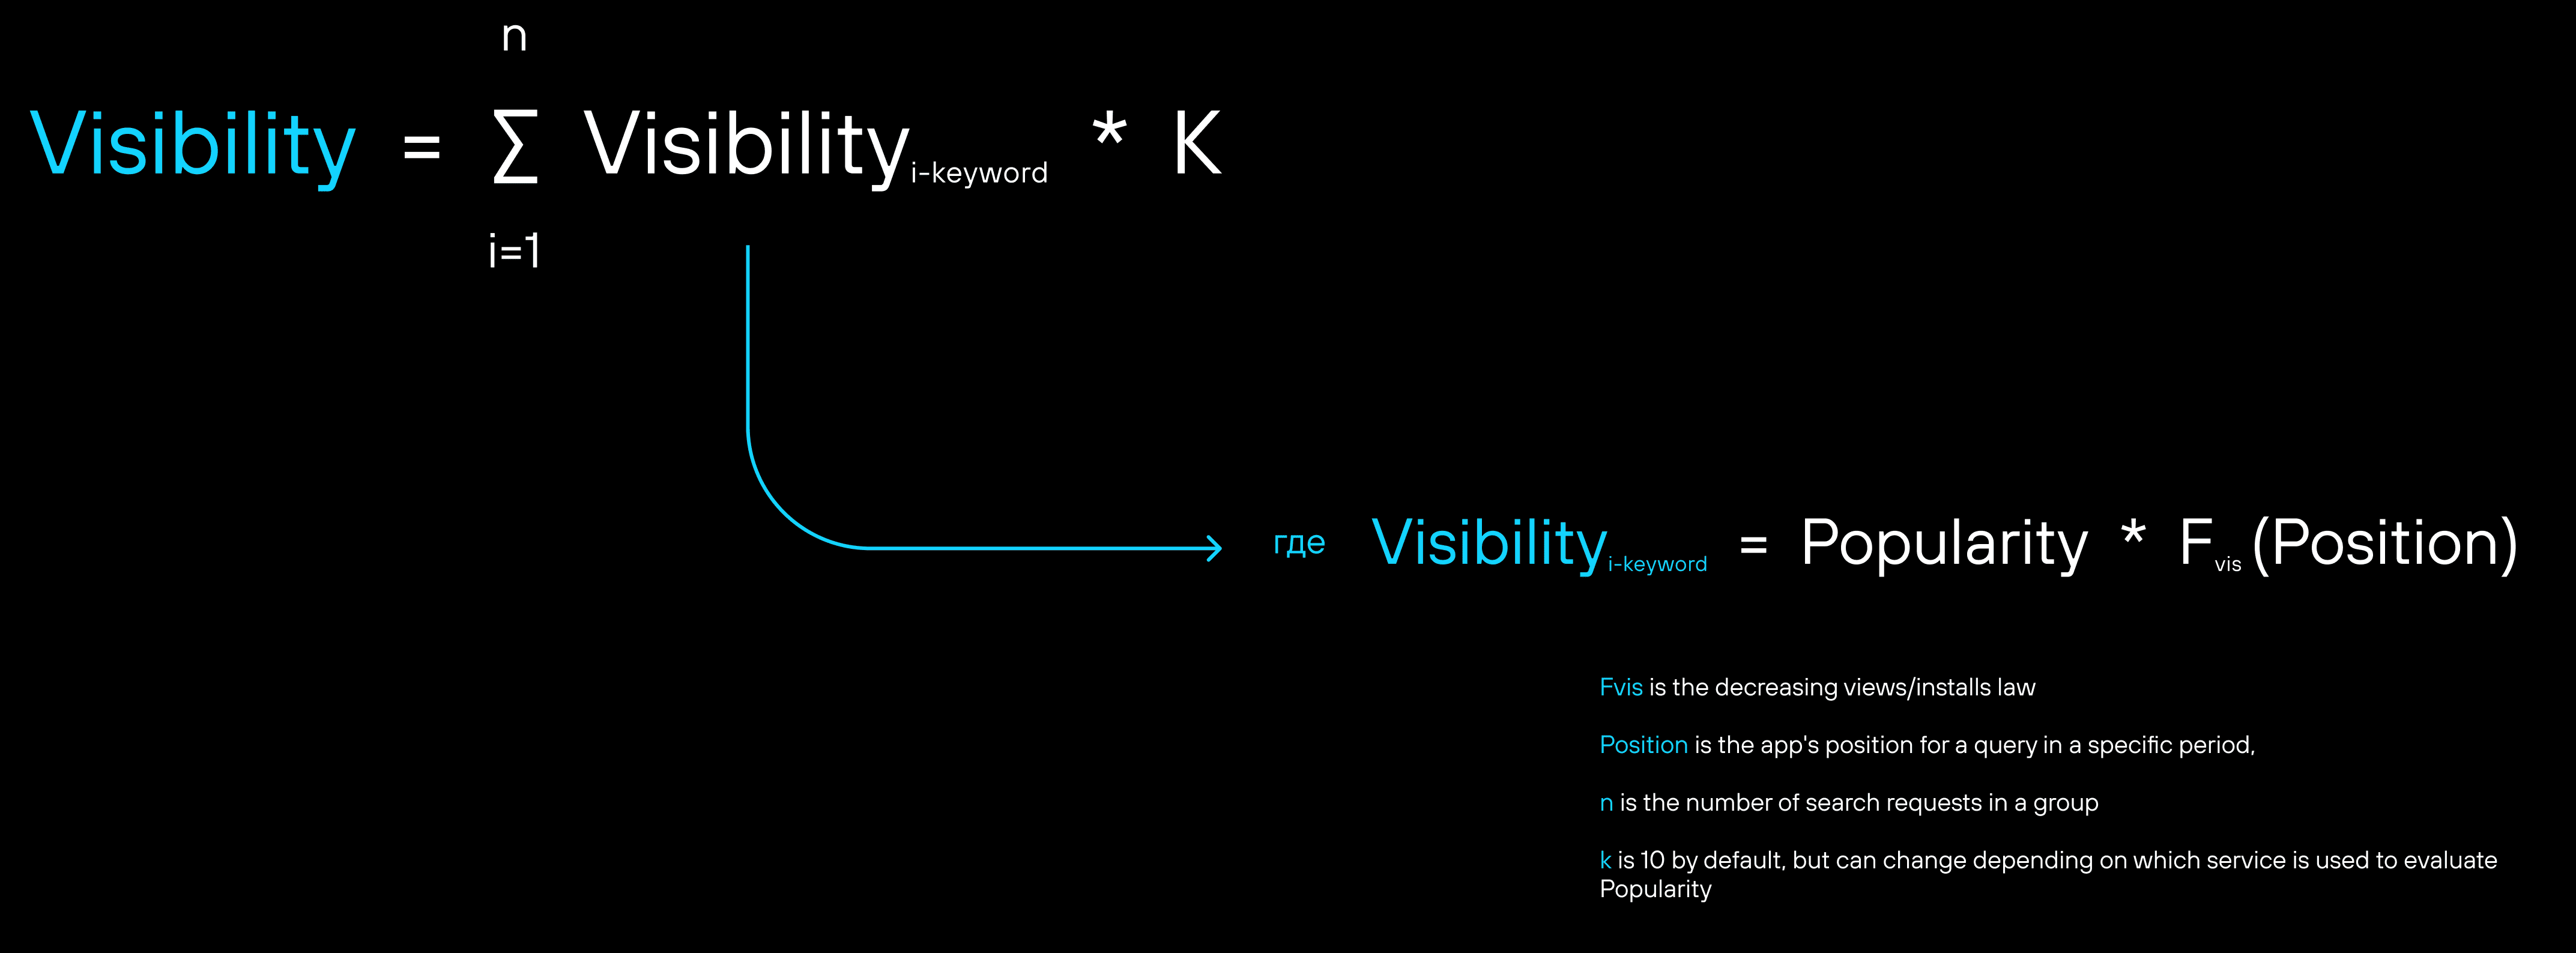
 Apparently, the higher the app's position in search and the higher the query frequency, the higher the Visibility index. We used this indicator to get a better picture when promoting applications in search.Let's take another look at Skyeng's Visibility chart for the period when the project was losing its positions. But this time, we will add some competitors:
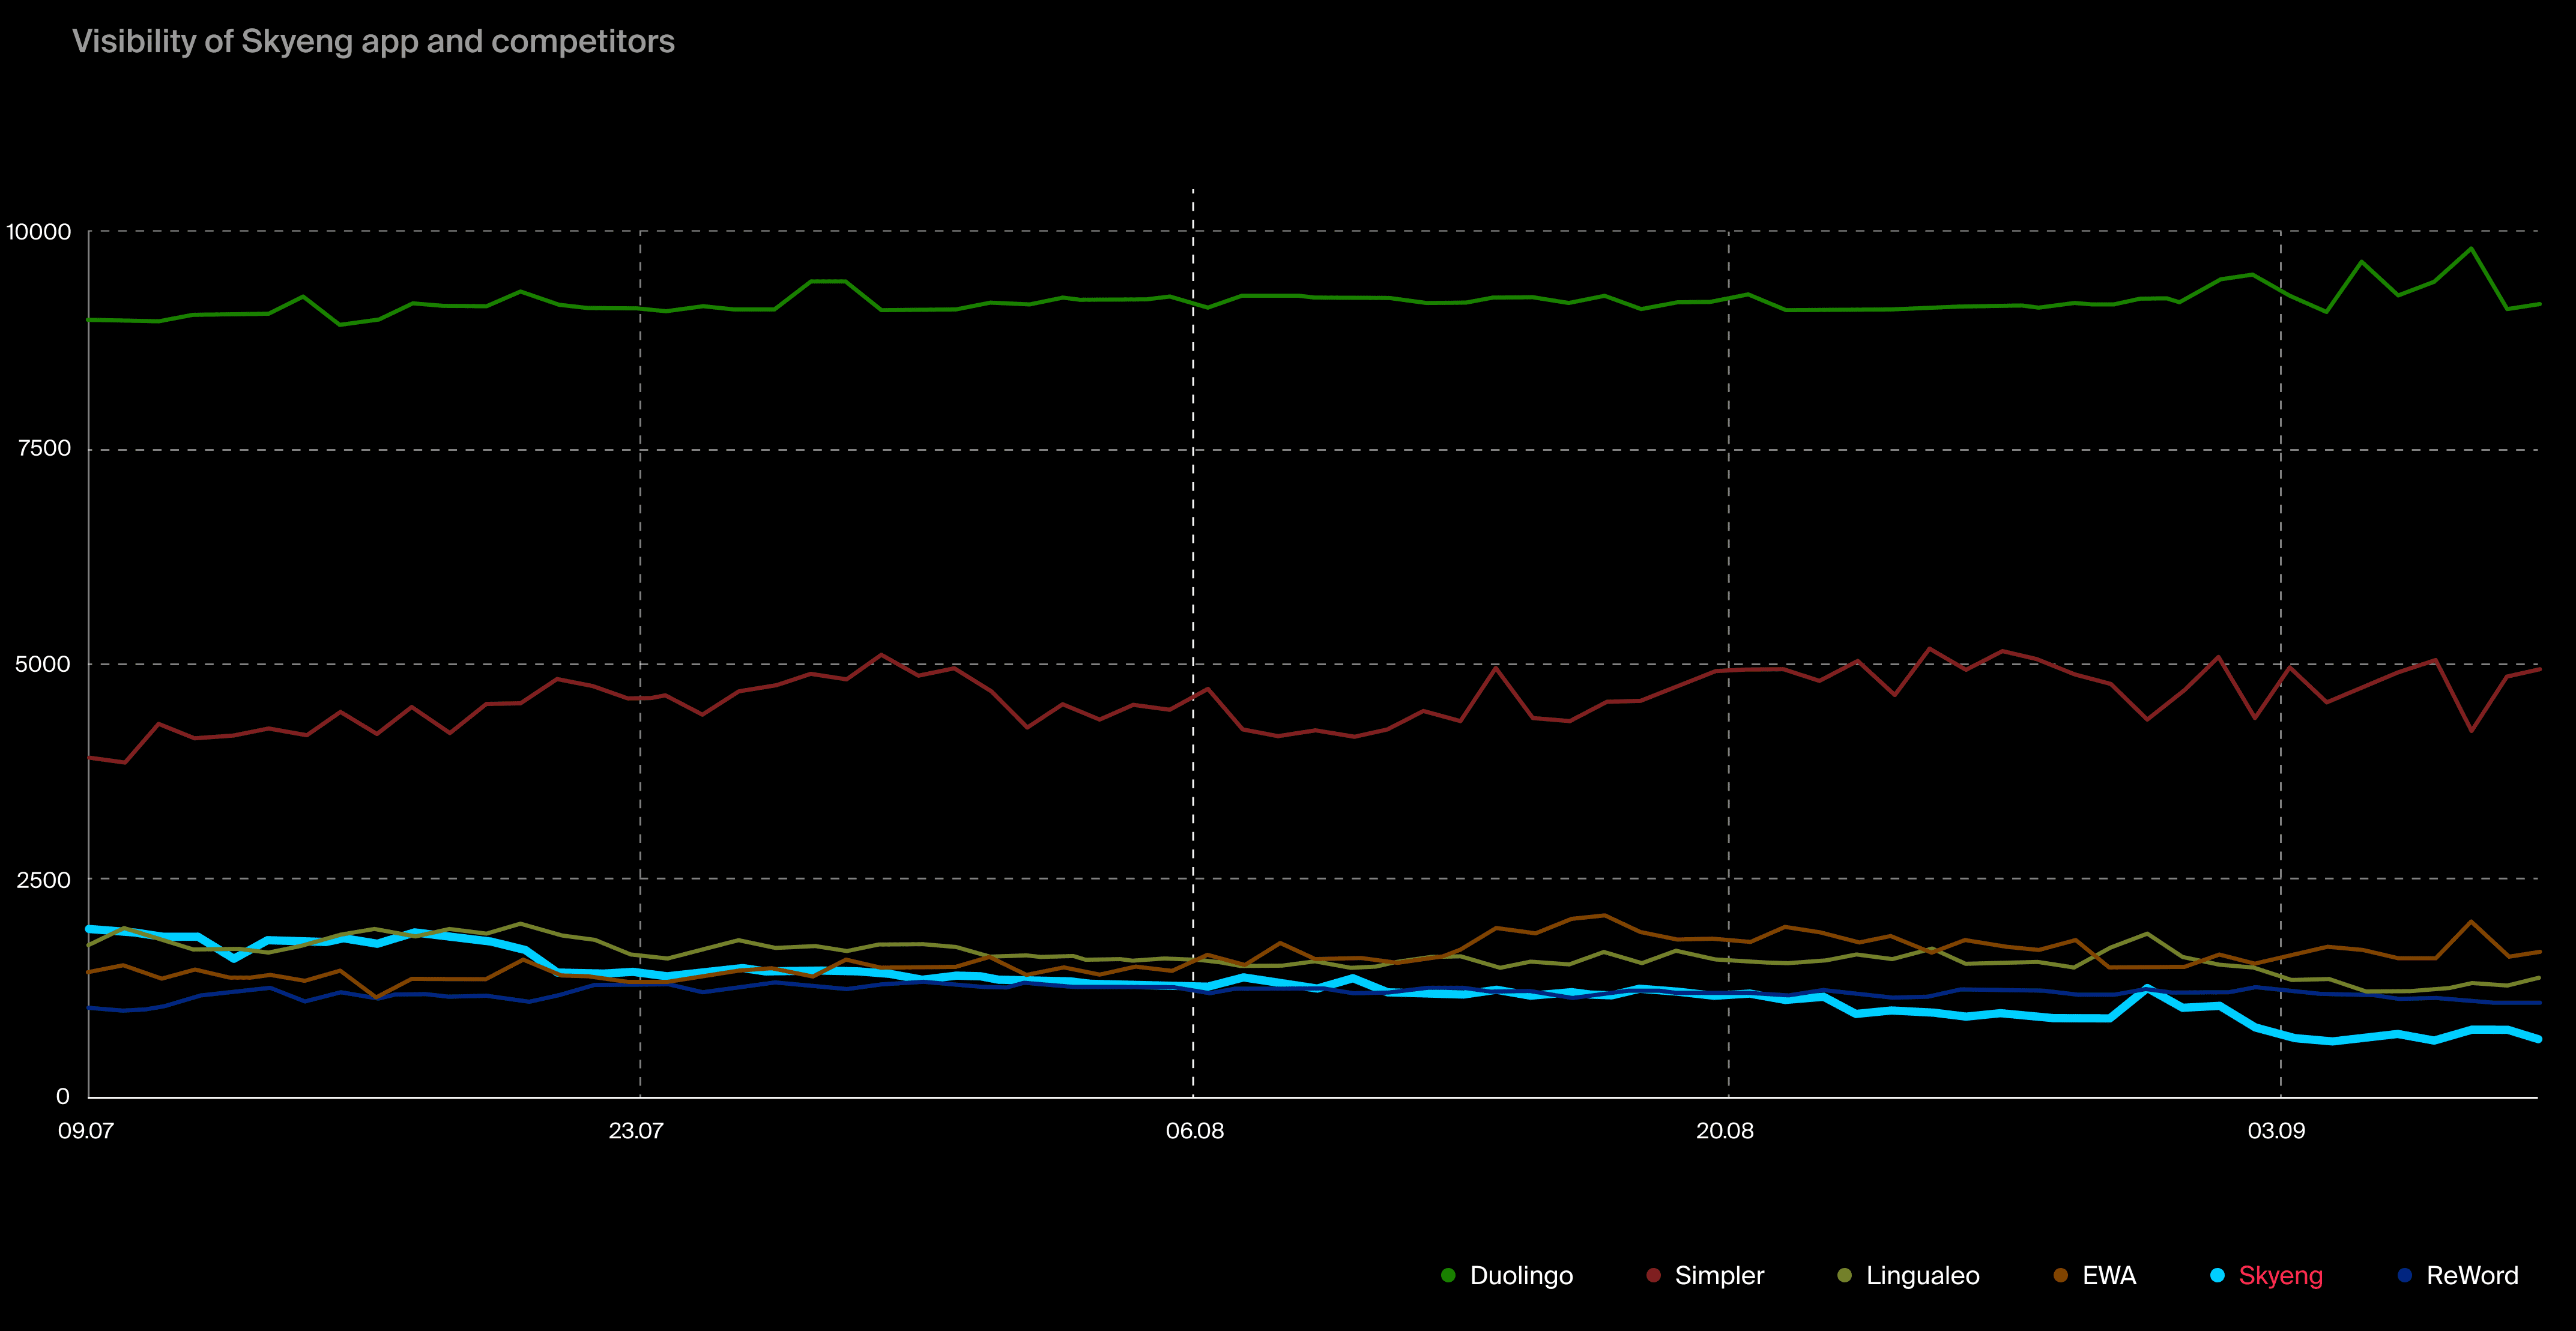
 We can see that the situation is not very favorable for Skyeng. Visibility against the competition wasn't very high before the decline, and shrank to 3.1% within two months. This data demonstrates the available potential that we can win back from other apps.Now let's examine Skyeng's organic installs chartWhen an app's position drops and visibility decreases, it's reasonable to expect fewer installs as well. We can't share the exact number of installs in this case, but we will showcase the dynamics in the chart, so you can see a general trend:
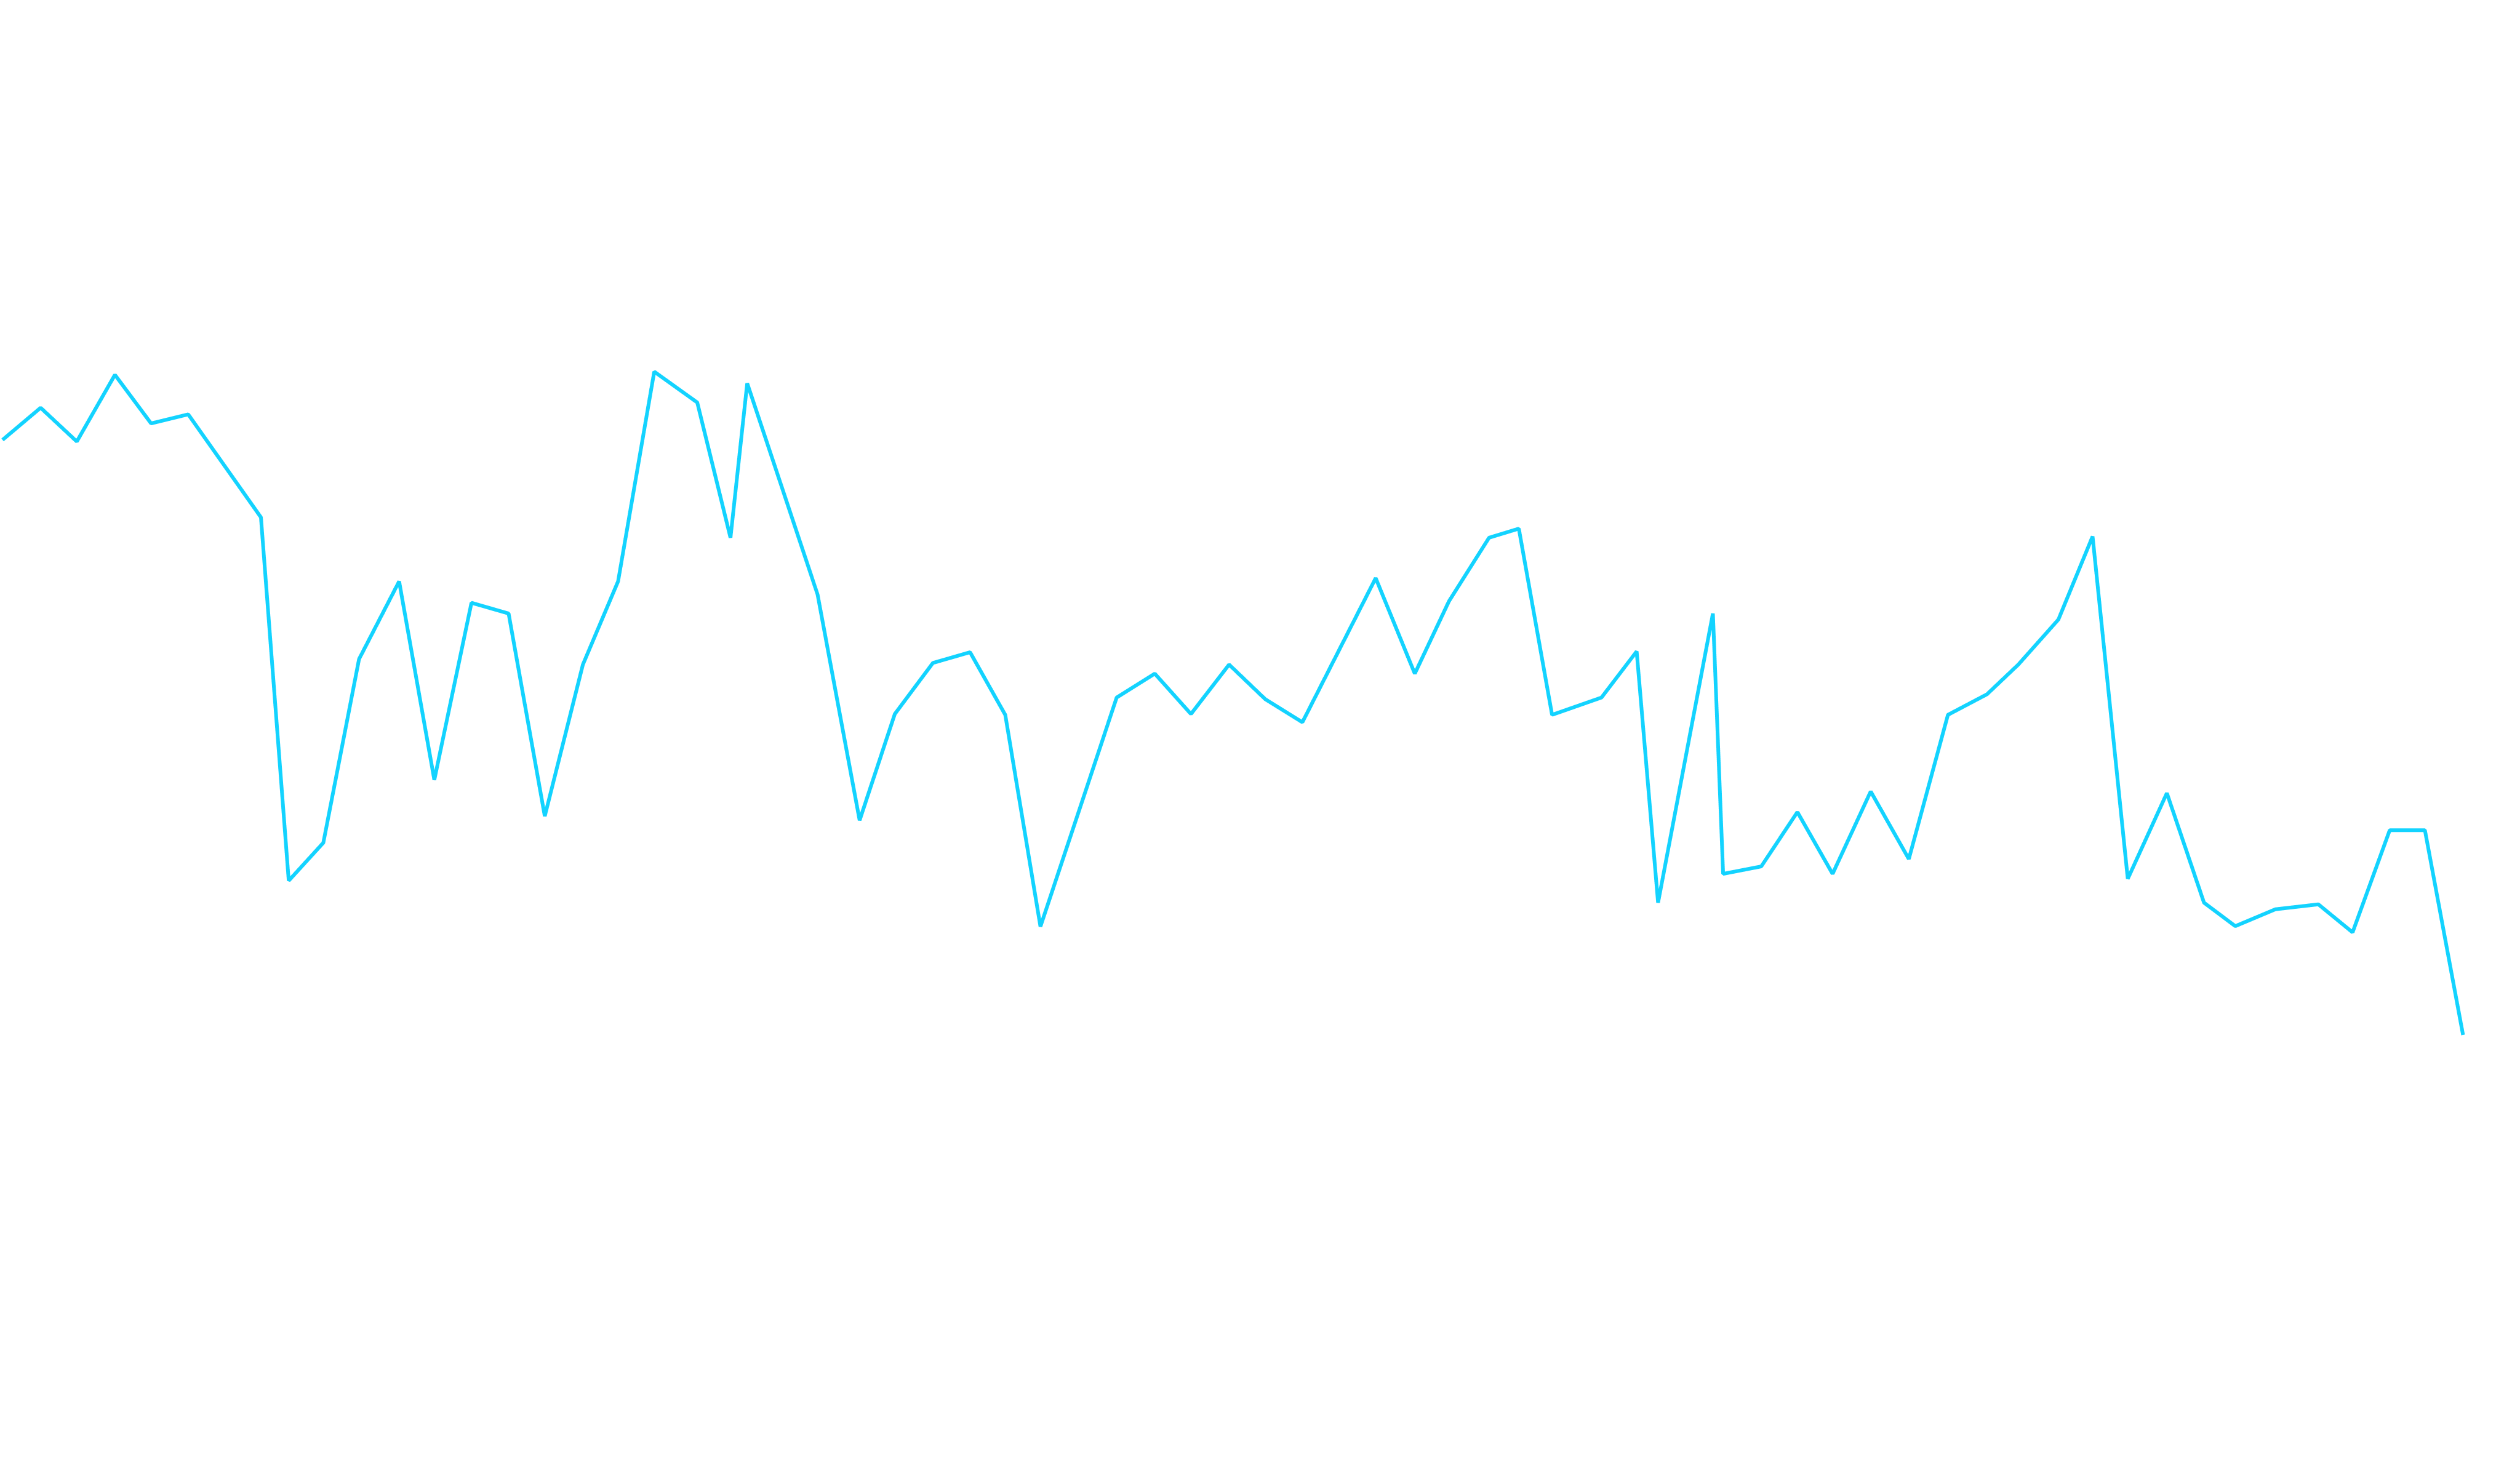
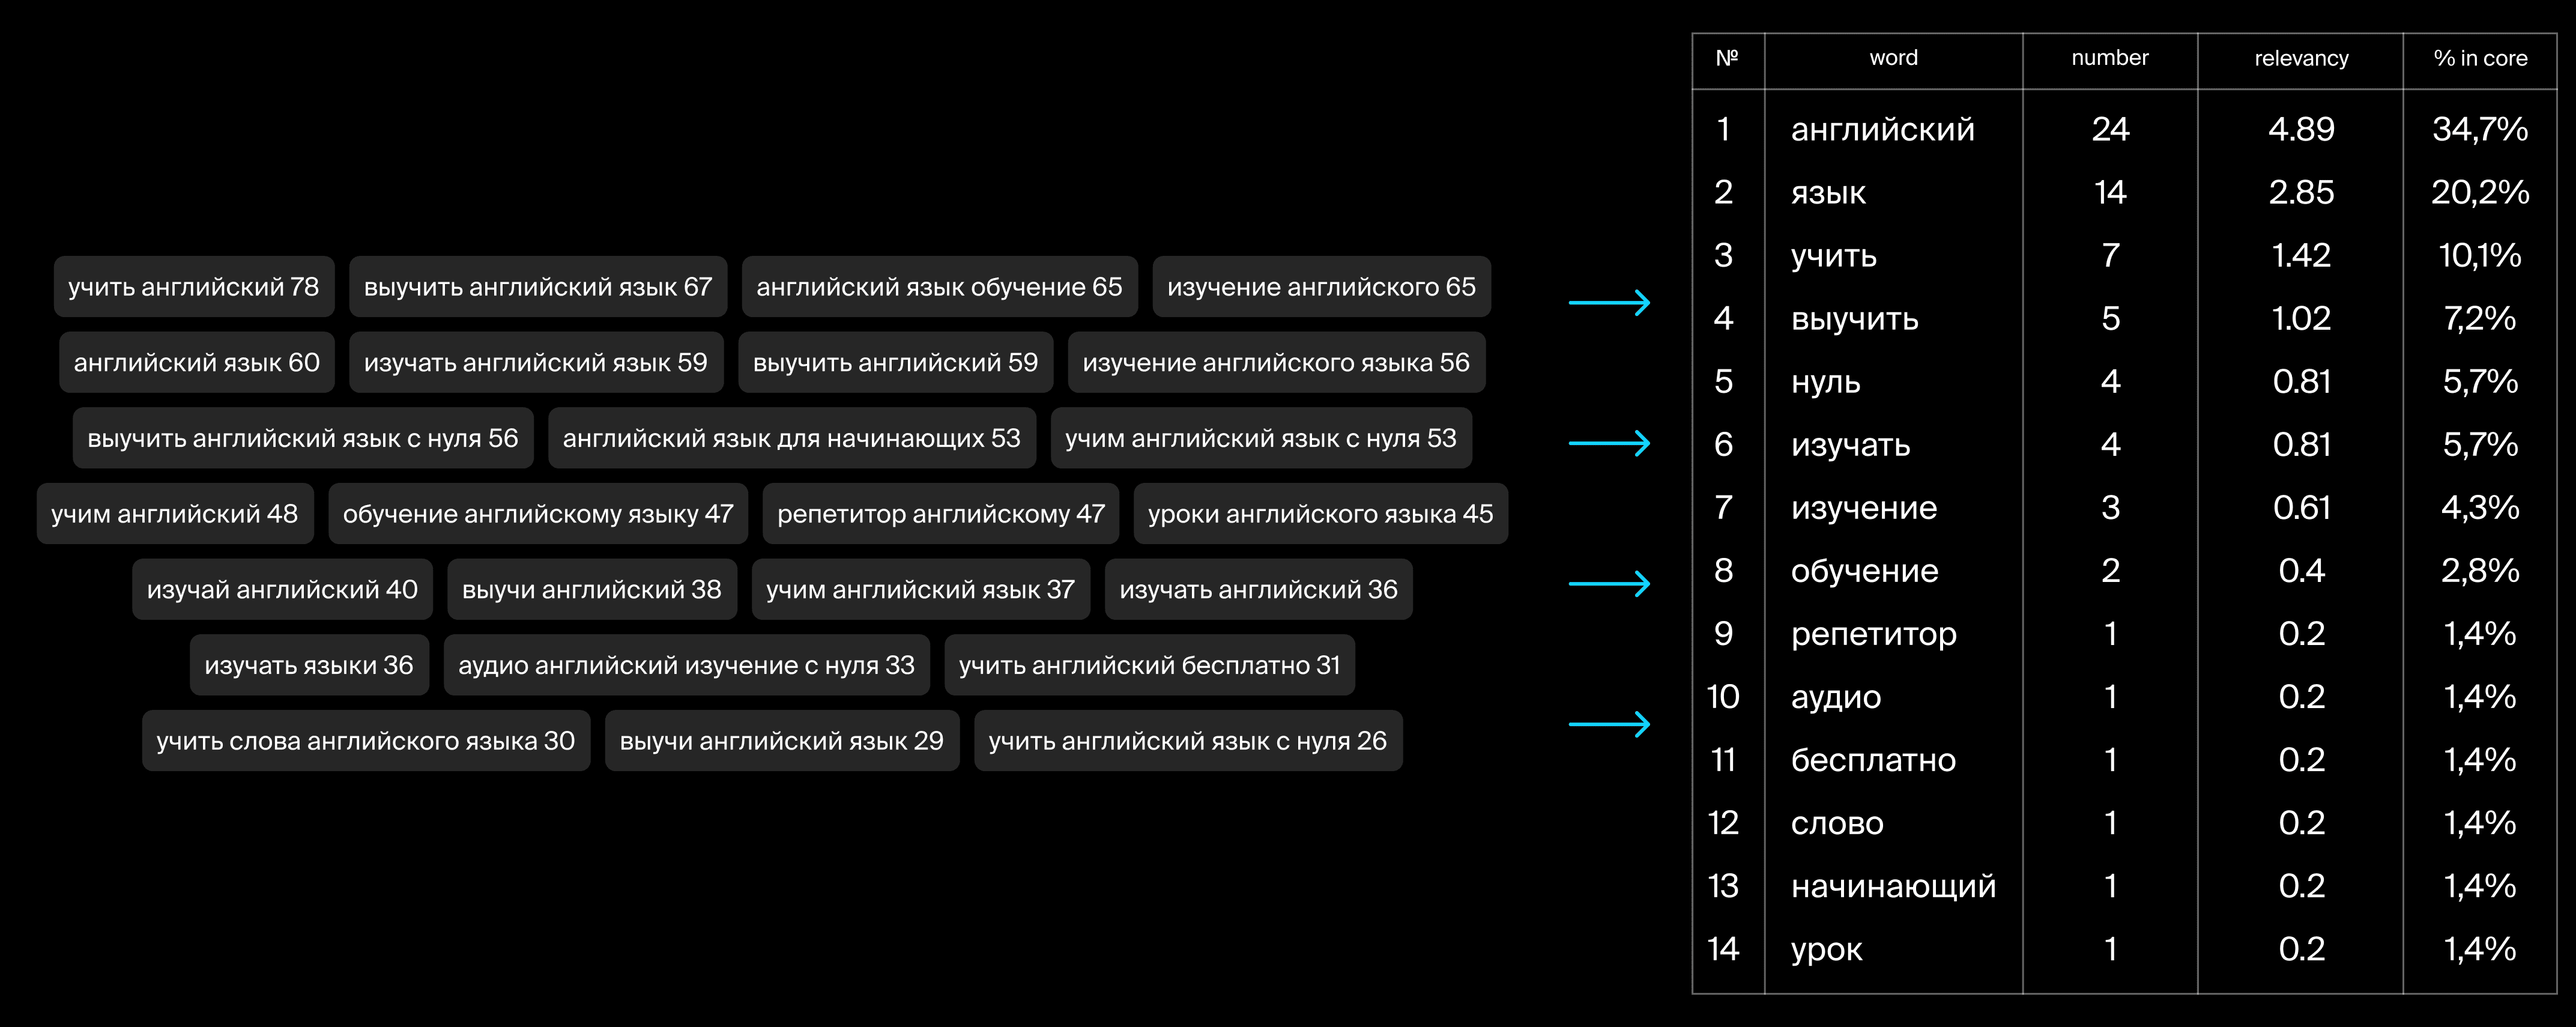
 Expectedly, we get a group of keywords that mostly consist of words related to English and learning. We will also take into account the number of occurrences of such words when evaluating textual metadata quality.Next, let's compare the Skyeng app and its competitors using a selected set of criteria
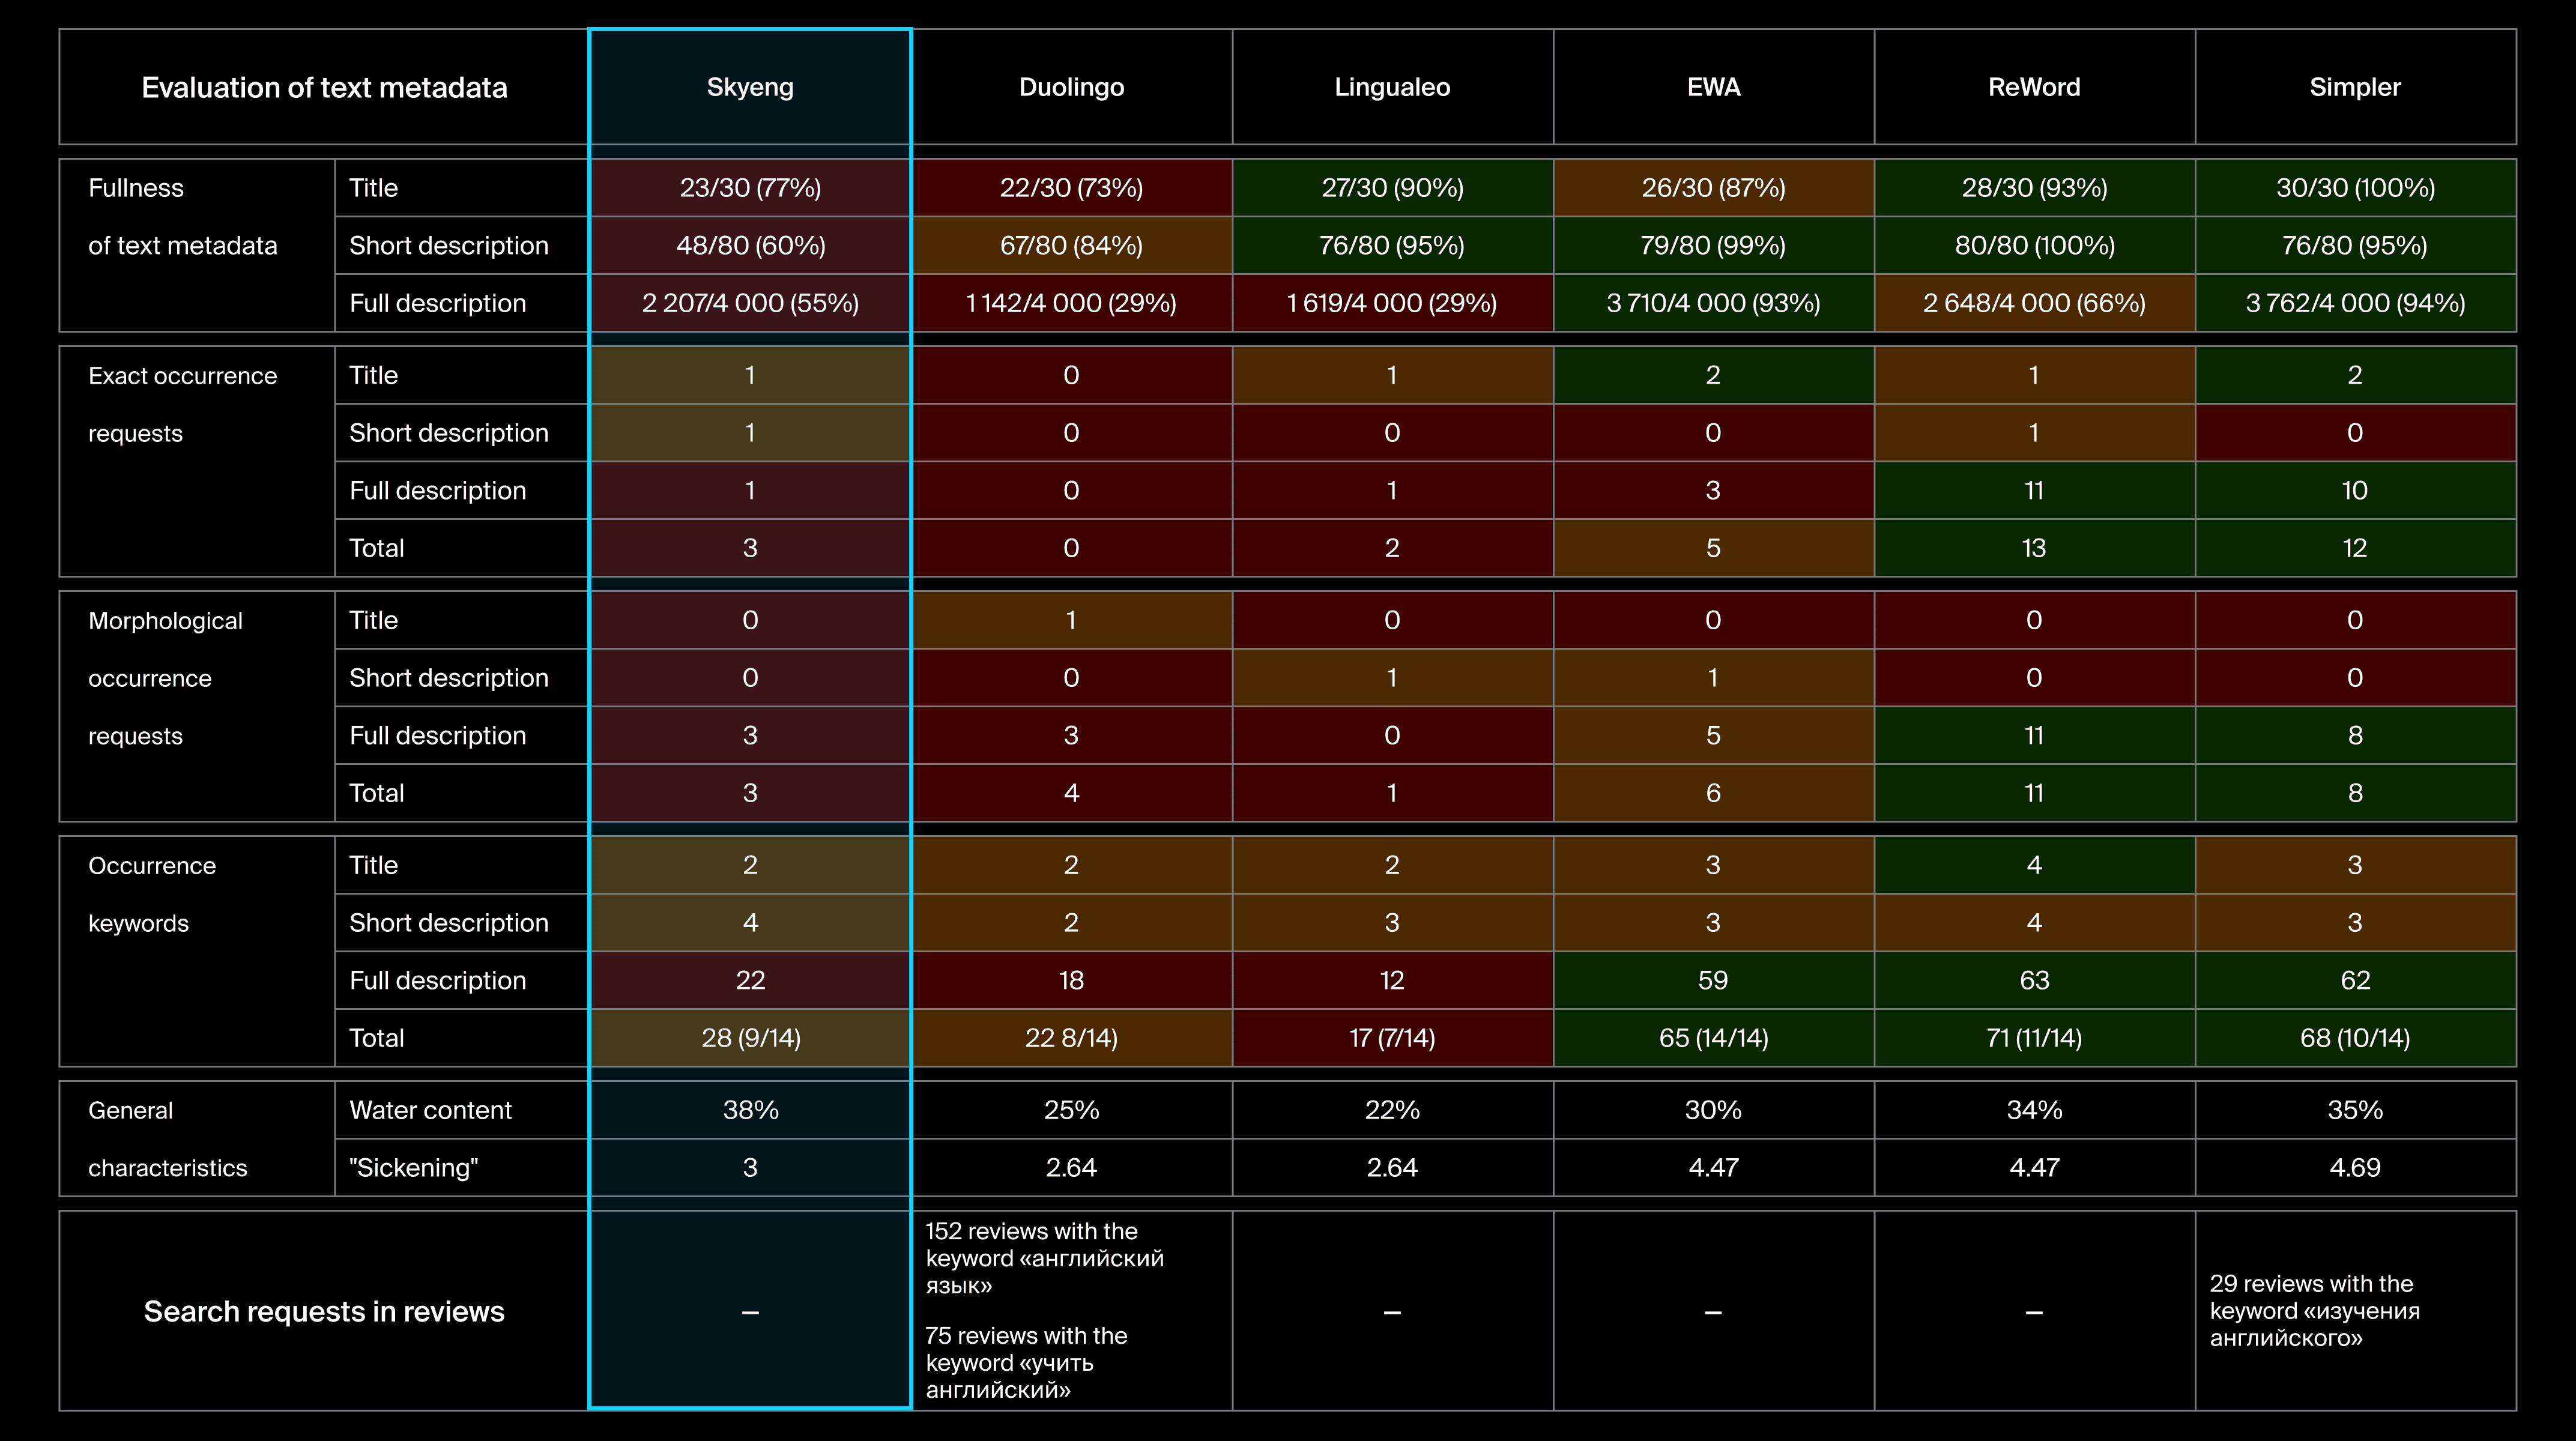

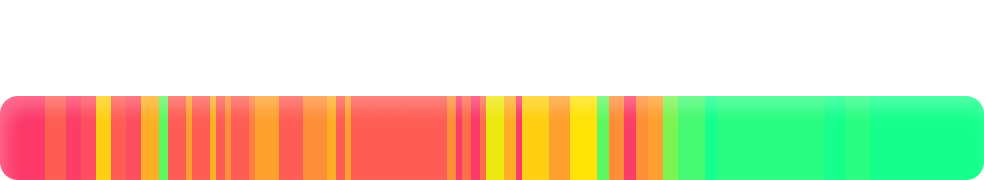
 Steady growth is also seen here, with the visibility of some competitors starting to decline. It makes sense because these rivals yielded high positions to Skyeng for some search requests. And though there are more rivals in search results than we used for our analysis, the change in visibility share is clearly visible in this data as well.How the visibility share had changed by November 14
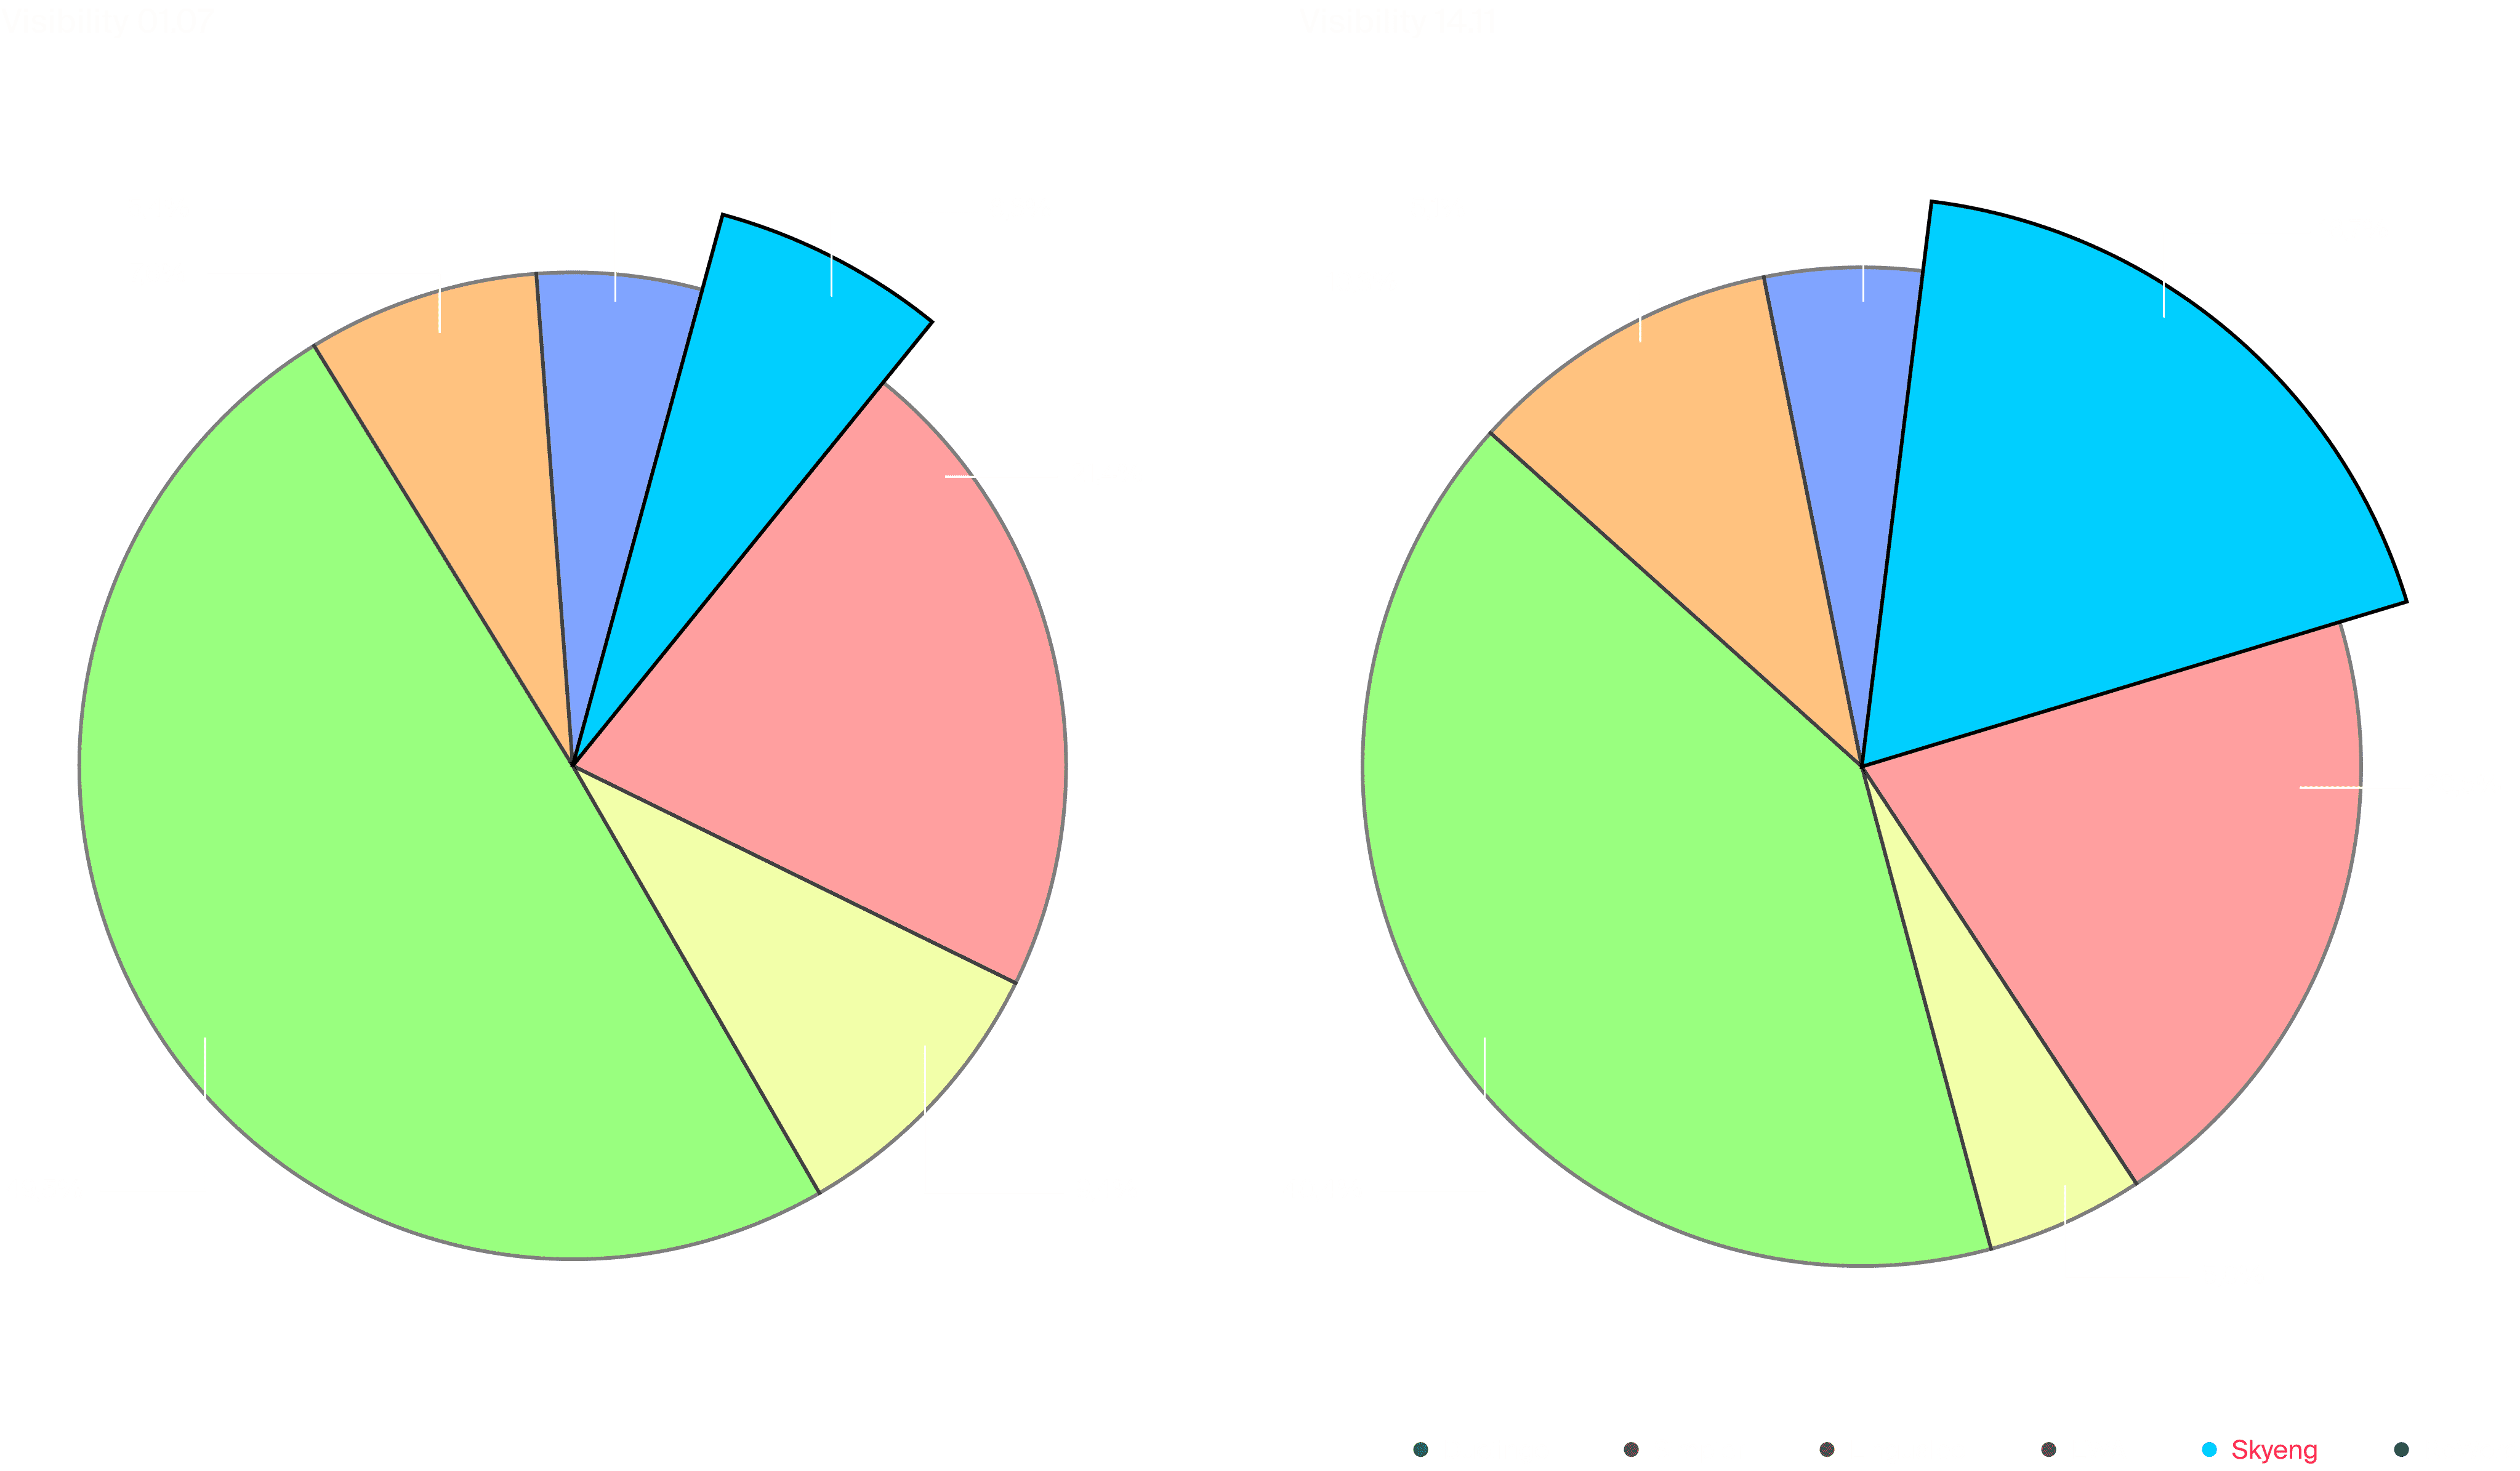
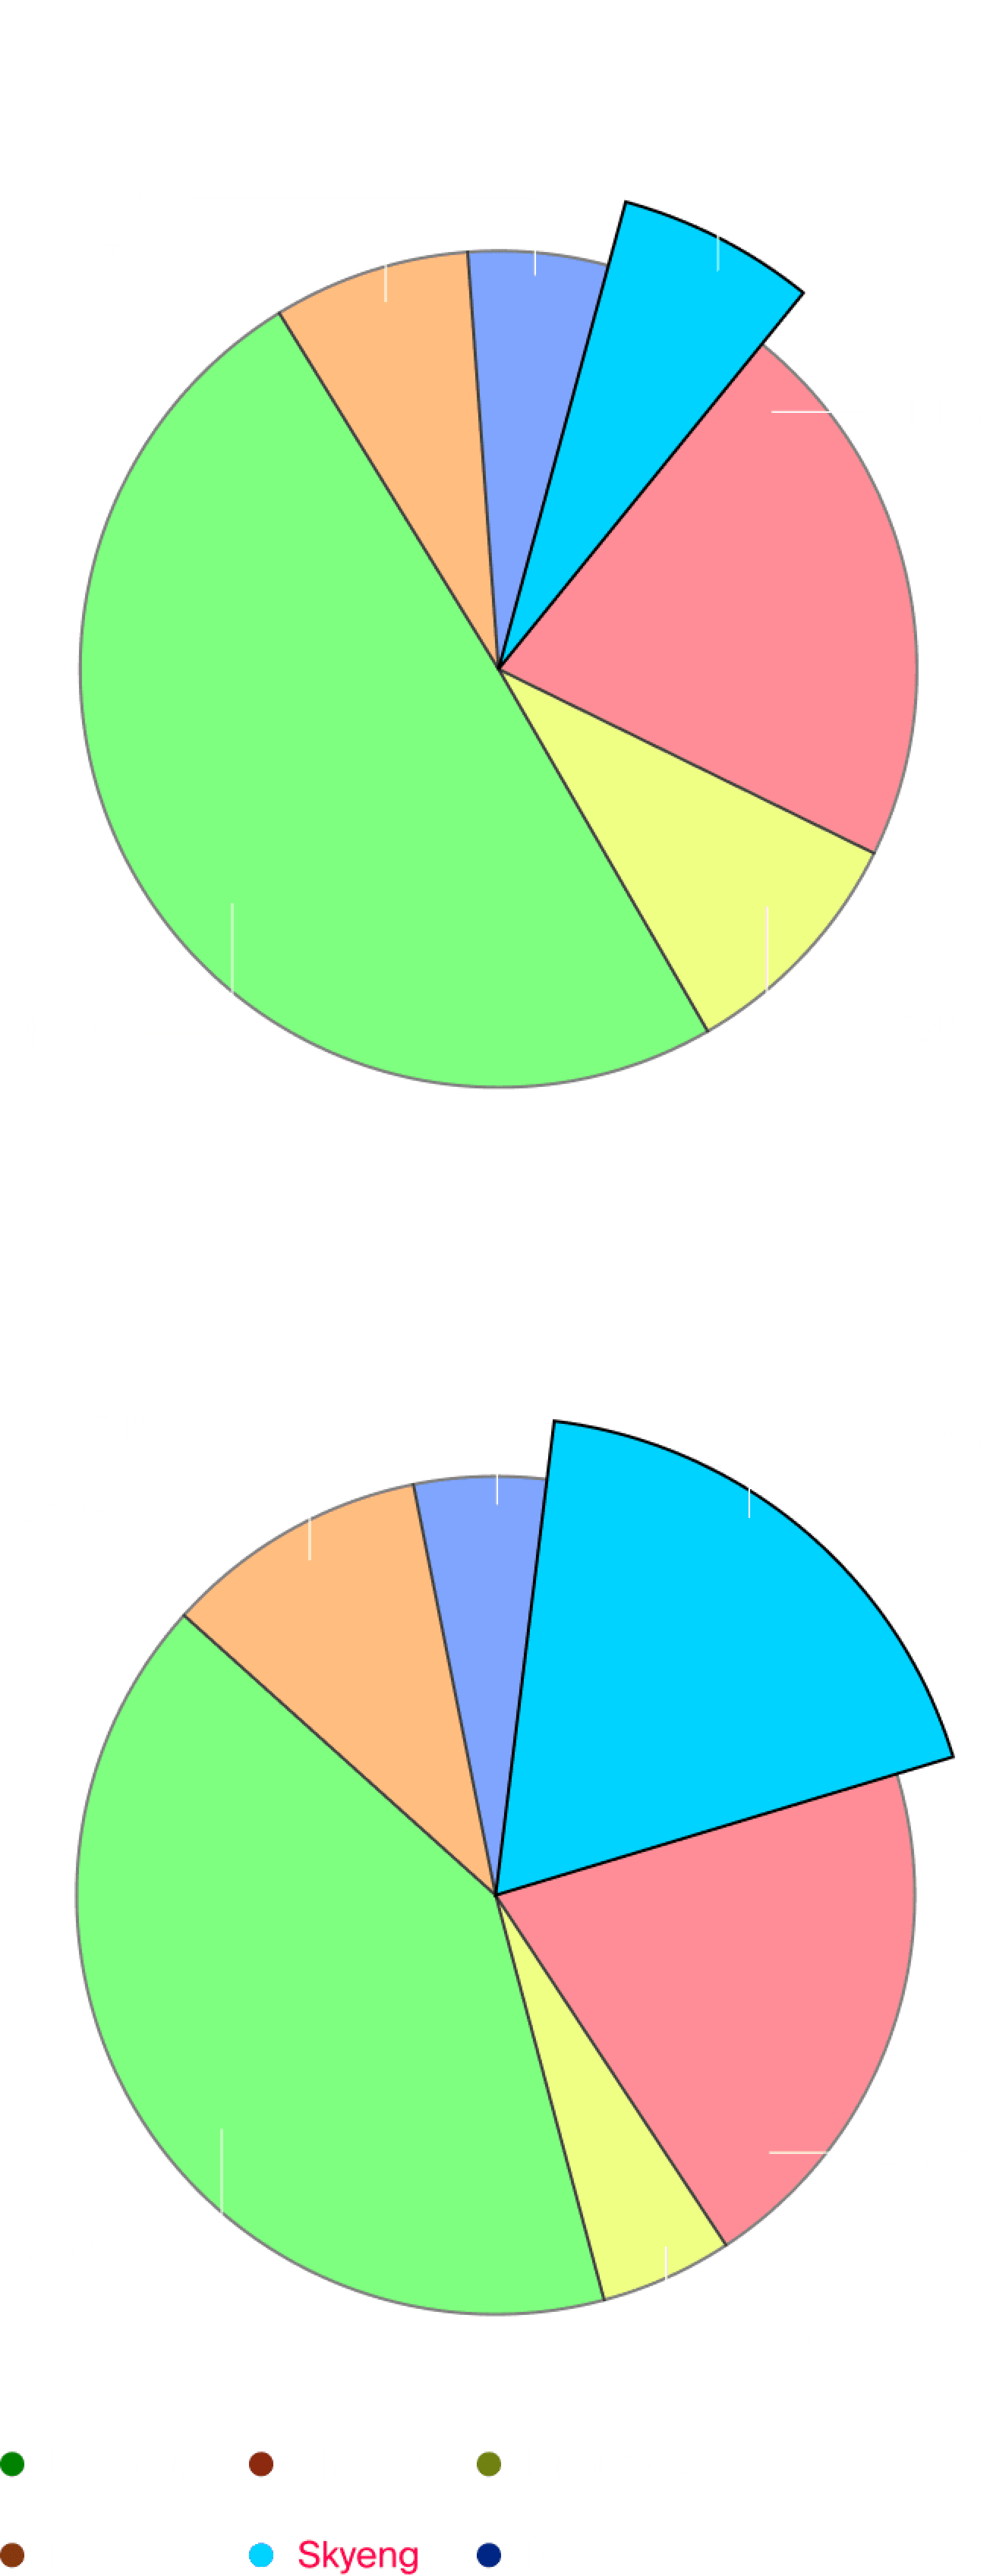 Relative to selected competitors, visibility has changed by 15 percentage points, placing Skyeng in 3rd place in terms of this indicator. It's certainly not number one, but Duolingo holds a very strong position and competing with this app for visibility is yet to come.How much of an impact Skyeng's increased visibility had on organic installsWe must remind that we can't demonstrate any exact values. So let's just take a look at the installs chart.
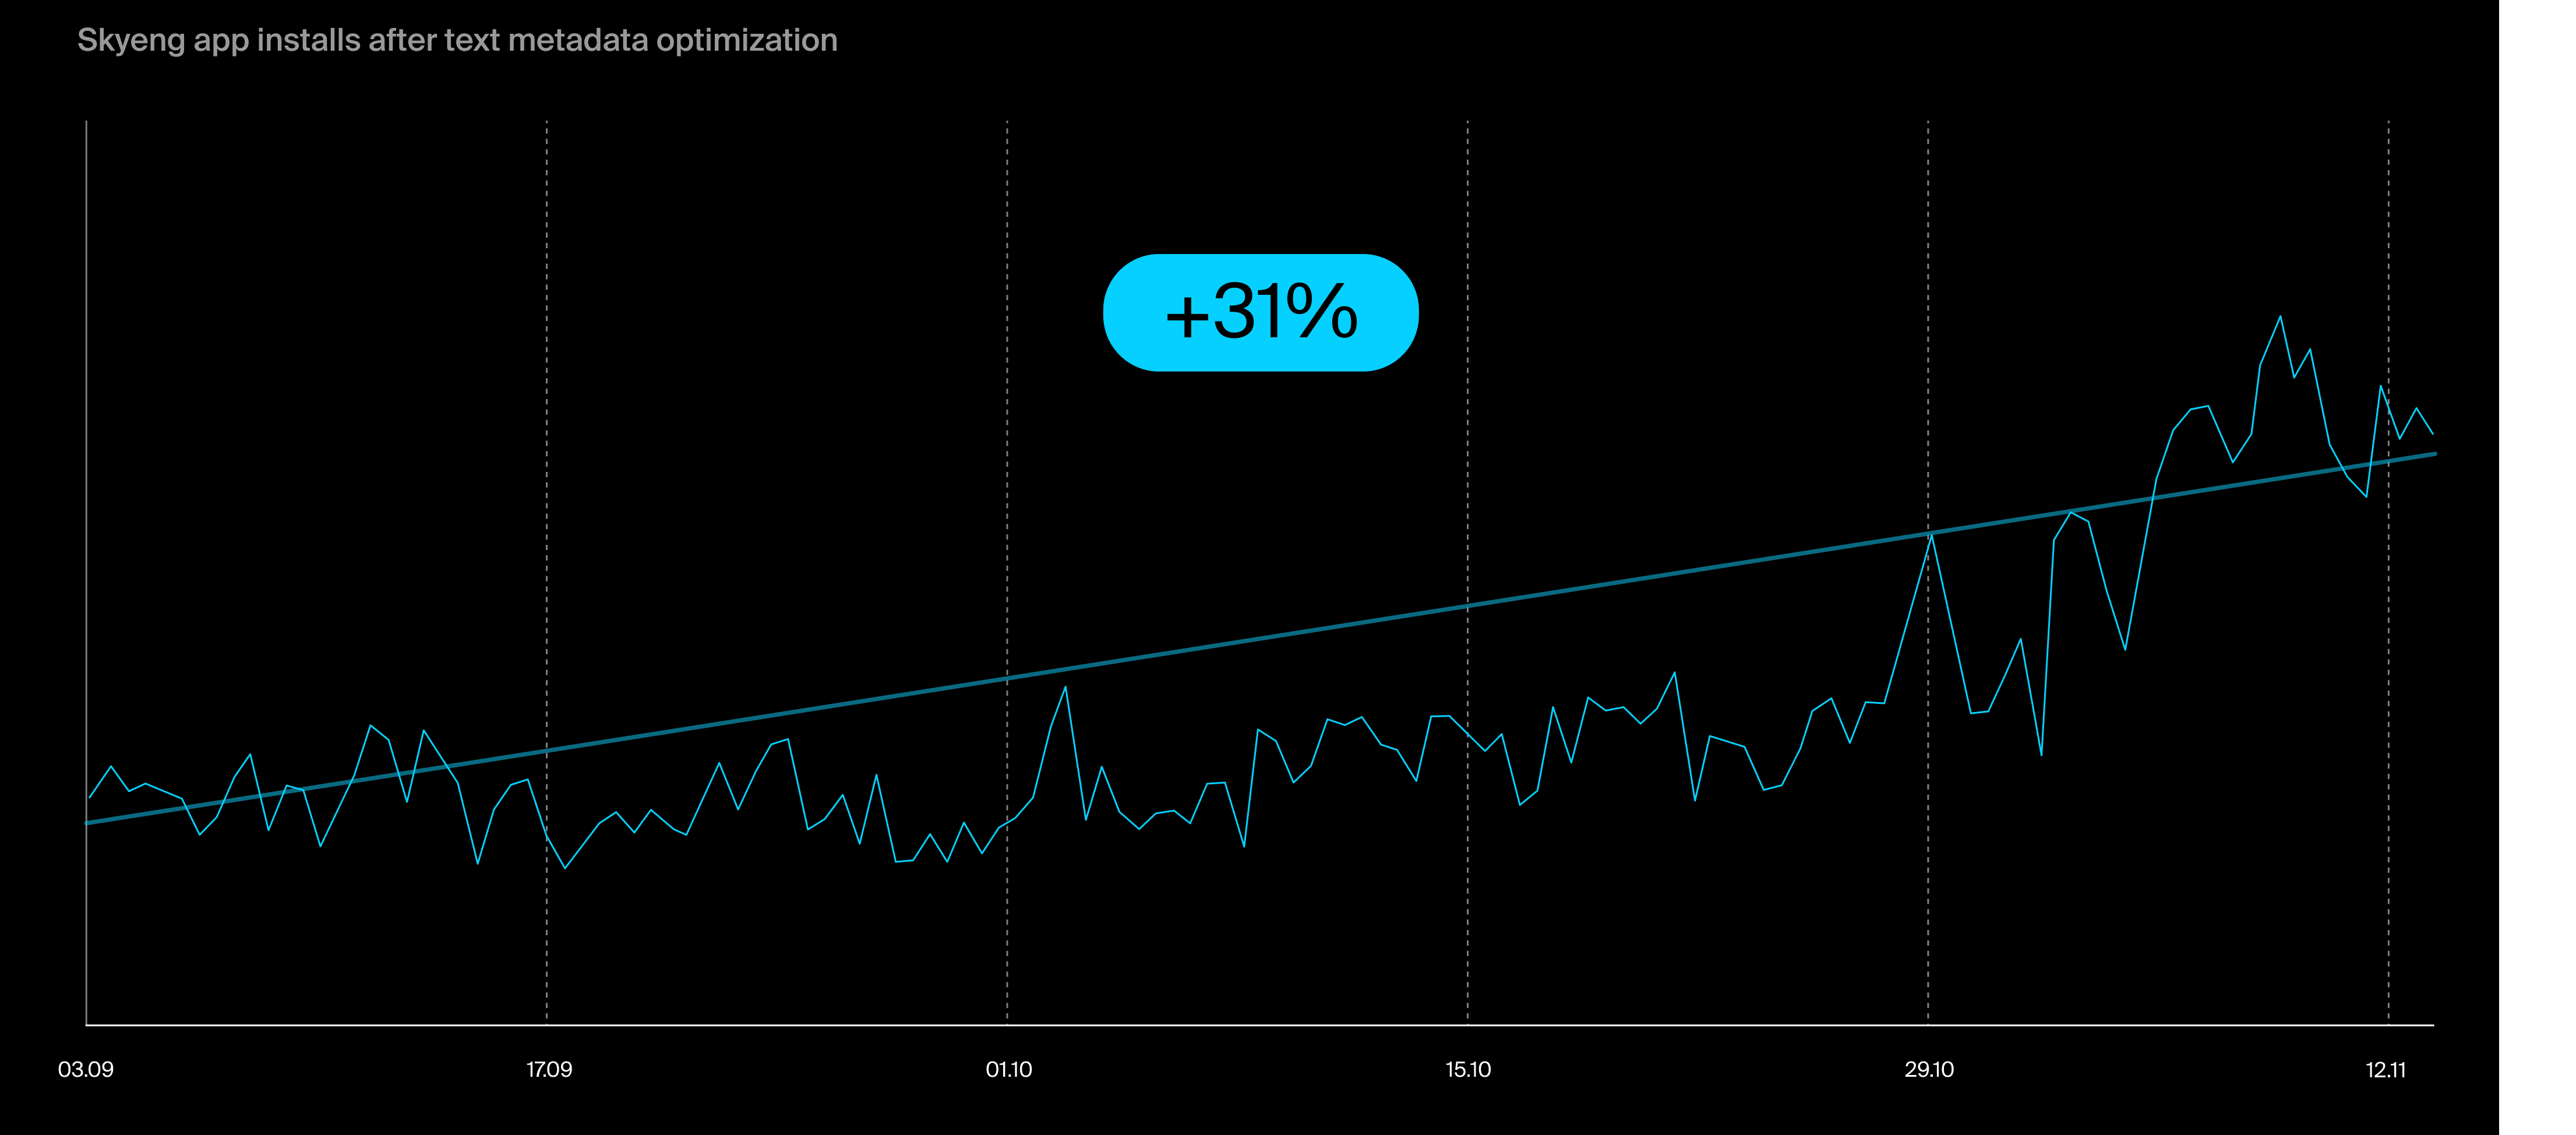
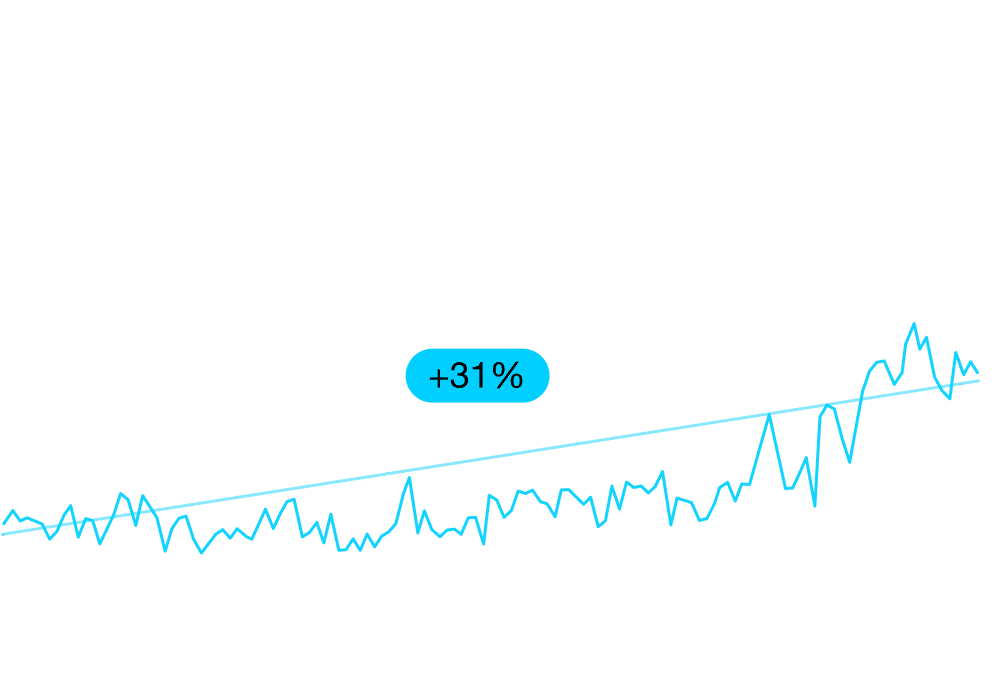 Along with the increase in visibility, there is also a clear trend toward more organic installations. We compared the number of installs for the same periods before and after metadata optimization and saw an increase of 31%.This is a good result. However, as previously mentioned, there is still a significant amount of work to be done. The vertical we are operating in has a broad semantic range and a high demand from organic sources. This indicates that there is ample opportunity to attract organic installations and anticipate even better results.